June 26, 2026 a 11:31 am


SPG: Dividend Analysis - Simon Property Group, Inc.
Simon Property Group, Inc. represents a strong value proposition for dividend-focused investors. With its steady dividend history and consistent growth, it offers moderate yet reliable returns. However, potential investors should keep an eye on the payout ratios and leverage metrics, which may impact the long-term sustainability of the dividends.
📊 Overview
Simon Property Group operates in the Retail REIT sector, known for its consistent dividend output. With a dividend yield of 4.15%, the current dividend per share stands at $8.57. The company has a robust 33-year dividend history with no recent cuts or suspensions, making it a reliable choice for income-seeking investors.
| Parameter | Details |
|---|---|
| Sector | Retail REIT |
| Dividend yield | 4.15 % |
| Current dividend per share | 8.57 USD |
| Dividend history | 33 years |
| Last cut or suspension | None |
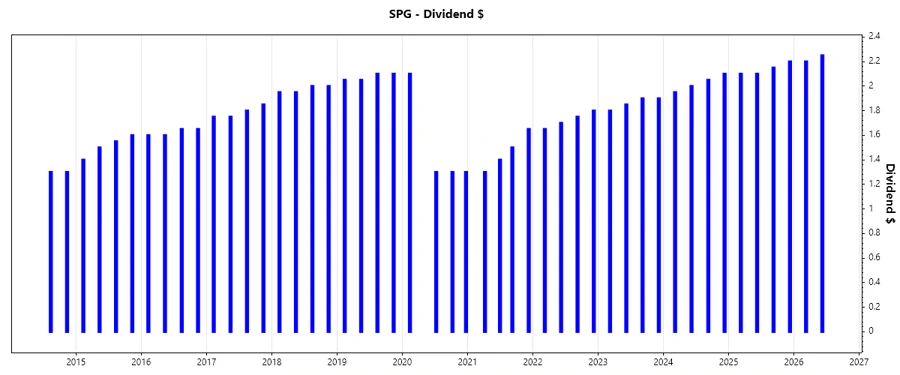
🗣️ Dividend History
The historical perspective offers insights into the stability and predictability of dividend payments, important for income-focused portfolios.
| Year | Dividend Per Share (USD) |
|---|---|
| 2026 | 4.45 |
| 2025 | 8.55 |
| 2024 | 8.10 |
| 2023 | 7.45 |
| 2022 | 6.90 |
📈 Dividend Growth
Dividend growth metrics reflect the company’s capability to enhance shareholder value over time. Observing these trends is crucial for assessing potential future income expansion.
| Time | Growth |
|---|---|
| 3 years | 7.41 % |
| 5 years | 7.34 % |
The average dividend growth is 7.34% over 5 years. This shows moderate but steady dividend growth, indicating a reliable revenue increase for investors.
✅ Payout Ratio
Evaluating payout ratios provides insights into how well earnings and free cash flows cover dividend payments, highlighting sustainability risks.
| Key Figure | Ratio |
|---|---|
| EPS-based | 59.30 % |
| Free cash flow-based | 85.13 % |
An EPS-based payout ratio of 59.30% is sustainable, suggesting the company retains a significant portion of its earnings. However, a high FCF payout ratio of 85.13% indicates limited free cash flow for other investments.
🧮 Cashflow & Capital Efficiency
These factors are vital for understanding a company's ability to generate cash and utilize capital effectively. It's essential for maintaining growth and meeting dividend commitments.
| Metric | 2025 | 2024 | 2023 |
|---|---|---|---|
| Free Cash Flow Yield | 5.91% | 5.45% | 6.73% |
| Earnings Yield | 7.65% | 4.22% | 4.90% |
| CAPEX to Operating Cash Flow | 20.38% | 19.81% | 20.18% |
| Stock-based Compensation to Revenue | 0% | 0% | 0% |
| Free Cash Flow / Operating Cash Flow Ratio | 79.62% | 80.19% | 79.82% |
The figures indicate stable cash flow generation. Strong earnings yield supports investment in operations, while a consistent free cash flow yield affirms dividend coverage.
📊 Balance Sheet & Leverage Analysis
A solid balance sheet is crucial for long-term sustainability. It determines a company's ability to manage debt and navigate economic fluctuations.
| Metric | 2025 | 2024 | 2023 |
|---|---|---|---|
| Debt-to-Equity | 5.60 | 8.42 | 8.77 |
| Debt-to-Assets | 71.88% | 76.48% | 77.35% |
| Debt-to-Capital | 84.86% | 89.39% | 89.77% |
| Net Debt to EBITDA | 3.61 | 4.66 | 5.19 |
| Current Ratio | 0.83 | 0.83 | 1.04 |
| Quick Ratio | 0.83 | 0.83 | 1.04 |
| Financial Leverage | 7.80 | 11.02 | 11.34 |
The leverage situation indicates moderate risks. Growing debt ratios present challenges, yet operational cash inflows mitigate these concerns to an extent.
📈 Fundamental Strength & Profitability
Strong fundamentals and profitability ensure sustained growth and investor rewards, crucial in volatile markets.
| Metric | 2025 | 2024 | 2023 |
|---|---|---|---|
| Return on Equity | 88.61% | 80.59% | 75.53% |
| Return on Assets | 11.37% | 7.32% | 6.66% |
| Margins: Net | 72.51% | 39.75% | 40.35% |
| Margins: EBIT | 100.16% | 61.34% | 62.80% |
| Margins: EBITDA | 123.46% | 84.14% | 86.36% |
| Research & Development to Revenue | 0% | 0% | 0% |
Profitability metrics demonstrate robust returns and margins, highlighting operational efficiency. Sustained ROE and EBITDA margins are particularly promising.
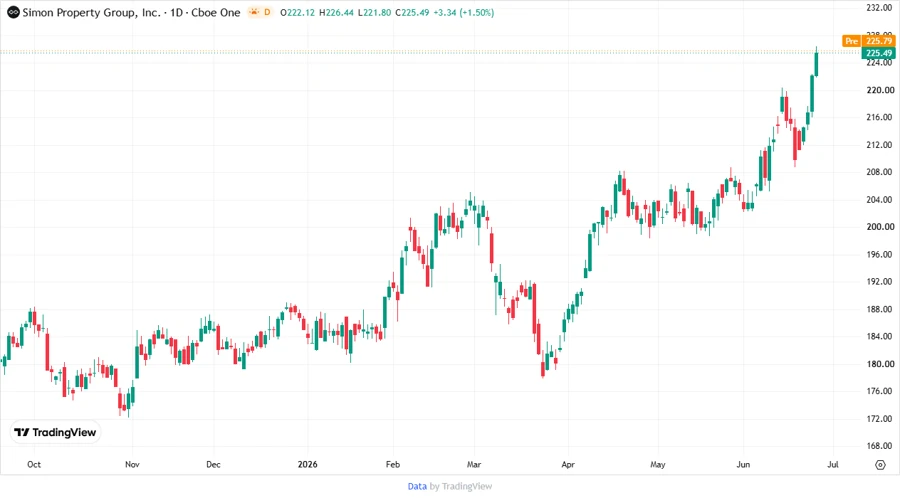
📉 Price Development
💼 Dividend Scoring System
| Category | Score | |
|---|---|---|
| Dividend yield | 4 | |
| Dividend Stability | 5 | |
| Dividend growth | 4 | |
| Payout ratio | 3 | |
| Financial stability | 2 | |
| Dividend continuity | 5 | |
| Cashflow Coverage | 3 | |
| Balance Sheet Quality | 3 |
Total Score: 29/40
🌟 Rating
Simon Property Group, Inc. offers an attractive dividend profile with a strong history of stability and consistent dividends. With a firm financial base, it’s a sound option for dividend-focused portfolios. However, investors should remain cautious of high leverage ratios and ensure ongoing evaluations of cash flow sustainability.
Smart Data Insight
Master the Perfect Entry & Exit for this Stock
Don't leave your profits to chance. Historically, this stock follows specific seasonal patterns that institutional traders use to maximize returns.
- ✅ Identify the "Golden Buying Window"
- ✅ Avoid high-risk correction cycles
- ✅ Backtested data from the last 20+ years