December 04, 2025 a 07:31 am


SPG: Dividend Analysis - Simon Property Group, Inc.
Simon Property Group, Inc. presents itself as a core pillar in the REIT sector with a substantial history of dividend payments. Despite facing challenges in the post-pandemic era, the group offers a commendable dividend yield indicative of substantial income generation potential. While the high payout ratio might raise concerns, it also underscores SPG's commitment to returning value to shareholders.
📊 Overview
Simon Property Group (SPG) operates within the Real Estate Investment Trusts (REITs) sector and boasts a notable dividend history, spanning over three decades. The current dividend yield stands at 4.69% with a robust dividend per share valued at 8.11 USD. Their resilience is demonstrated through their strategic recovery post-2021 adjustments.
| Attribute | Value |
|---|---|
| Sector | Real Estate Investment Trusts (REITs) |
| Dividend yield | 4.69% |
| Current dividend per share | 8.11 USD |
| Dividend history | 32 years |
| Last cut or suspension | 2021 |
📉 Dividend History
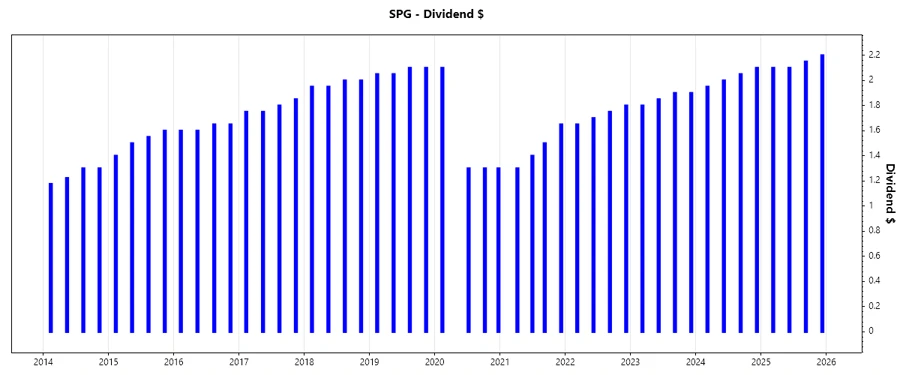
The dividend history of SPG reflects a steady increase in shareholder returns, despite temporary setbacks. The consistent year-on-year distributions illustrate management's steadfast dedication to maintaining payout consistency.
This visual illustrates SPG's dividend trend over the years, emphasizing the company's resilience in dividend payments.
| Year | Dividend per Share (USD) |
|---|---|
| 2025 | 8.55 |
| 2024 | 8.10 |
| 2023 | 7.45 |
| 2022 | 6.90 |
| 2021 | 5.85 |
📈 Dividend Growth
The analysis of dividend growth reveals a modest increase over recent years. Growth stability is a key indicator for prospective investment returns, crucial for gauging the financial vitality and shareholder value delivery of a firm.
| Time | Growth |
|---|---|
| 3 years | 11.46% |
| 5 years | -0.49% |
The average dividend growth is -0.49% over 5 years. This shows moderate but steady dividend growth, which might suggest varying external economic influences impacting growth.
This chart accentuates the progression and setbacks of SPG’s dividends, providing a visual trajectory of growth.
🗣️ Payout Ratio
Evaluating the payout ratio is essential since it measures the proportion of earnings a company returns to its shareholders as dividends. In essence, it provides insights into dividend sustainability and potential future growth.
| Key figure | Ratio |
|---|---|
| EPS-based | 118.79% |
| Free cash flow-based | 69.68% |
The high EPS-based payout ratio of 118.79% raises caution regarding dividend safety, indicating SPG might be distributing more than its earnings. However, the FCF-based ratio at 69.68% suggests they are more sustainable when considering cash flows.
💡 Cashflow & Capital Efficiency
An analysis of cash flow and capital efficiency highlights how effectively SPG manages its financial resources. Key indicators include free cash flow yield and earnings yield, crucial for identifying operational efficiency and investment viability.
| Metric | 2024 | 2023 | 2022 |
|---|---|---|---|
| Free Cash Flow Yield | 5.45% | 6.73% | 8.09% |
| Earnings Yield | 4.22% | 4.90% | 5.56% |
| CAPEX to Operating Cash Flow | 19.81% | 20.18% | 17.26% |
| Stock-based Compensation to Revenue | 0% | 0% | 0.47% |
| Free Cash Flow / Operating Cash Flow Ratio | 80.19% | 79.81% | 82.74% |
Simon Property Group has shown competent cash flow management; however, a gradual decline in FCF yield might require strategic focus. The FCF/OCF ratio reflects generous cash flow coverage of dividends, ensuring investor confidence.
🔍 Balance Sheet & Leverage Analysis
Assessing the balance sheet dynamics is vital to understanding financial stability and leverage. Key metrics such as Debt-to-Equity and Current Ratio determine the firm's risk profile and liquidity.
| Metric | 2024 | 2023 | 2022 |
|---|---|---|---|
| Debt-to-Equity | 842.47% | 877.27% | 811.15% |
| Debt-to-Assets | 76.48% | 77.35% | 77.12% |
| Debt-to-Capital | 89.39% | 89.77% | 89.02% |
| Net Debt to EBITDA | 4.66 | 5.19 | 5.41 |
| Current Ratio | 0.83 | 1.04 | 0.66 |
| Quick Ratio | 0.83 | 1.04 | 0.66 |
| Financial Leverage | 1101.51% | 1134.15% | 1051.81% |
The substantial leverage ratios reflect potential debt risk exposure, albeit offset by a steady interest coverage ratio, supporting financial robustness.
🚀 Fundamental Strength & Profitability
Reviewing profitability metrics underscores SPG's operational prowess. Return on Equity and Asset yields indicate how deftly the group's assets produce returns, with attention to margin analysis heightening comprehensive evaluations.
| Metric | 2024 | 2023 | 2022 |
|---|---|---|---|
| Return on Equity | 80.59% | 75.53% | 68.17% |
| Return on Assets | 7.32% | 6.66% | 6.48% |
| Margins: Net | 39.75% | 40.35% | 40.43% |
| Margins: EBIT | 61.34% | 62.80% | 62.31% |
| Margins: EBITDA | 84.14% | 86.36% | 86.73% |
| Margins: Gross | 82.50% | 81.83% | 81.08% |
While SPG exhibits high returns supported by strong margins, close scrutiny of ROIC demonstrates a proficient use of capital resources, affirming SPG’s financial aptness.
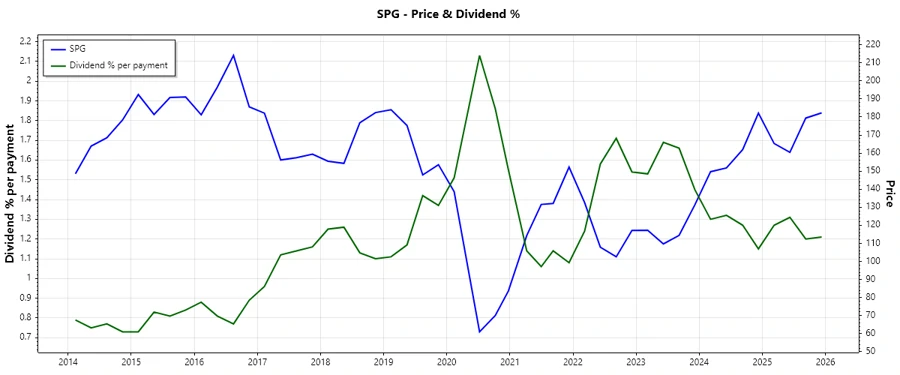
📉 Price Development
A graphical depiction of SPG's stock price progression, showcasing its volatility and growth patterns.
✅ Dividend Scoring System
| Category | Score | Score Bar |
|---|---|---|
| Dividend yield | 4 | |
| Dividend Stability | 5 | |
| Dividend growth | 3 | |
| Payout ratio | 2 | |
| Financial stability | 4 | |
| Dividend continuity | 5 | |
| Cashflow Coverage | 4 | |
| Balance Sheet Quality | 3 |
Total Score: 30/40
🌟 Rating
Simon Property Group, Inc. presents a stable dividend proposition with high consistency and yield, despite certain concerns in the payout and leverage indicators. The overarching recommendation leans towards cautious optimism for dividend-focused investors, particularly those valuing stability and structured growth within the REIT sector.