May 15, 2026 a 02:03 pm
SPGI: Trend and Support & Resistance Analysis - S&P Global Inc.
S&P Global Inc., a leader in providing credit ratings, benchmarks, analytics, and workflow solutions across global markets, has shown fluctuating performance in recent months. Amidst diverse offerings and multiple operational divisions, the stock presents technical indicators suggesting a potential market correction phase. Investors must stay vigilant about support and resistance levels, particularly amid volatile market conditions.
Trend Analysis
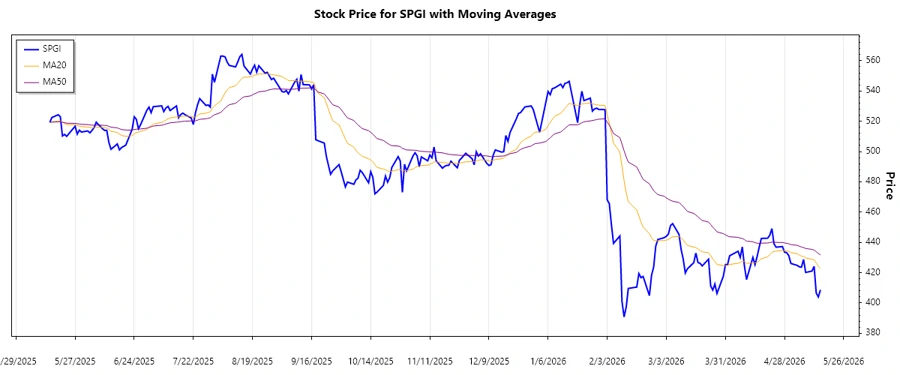
The analysis of S&P Global Inc. over the last several months reveals a strong shift in stock dynamics. Recent fluctuations indicate complex market conditions. From the calculated Exponential Moving Averages (EMAs):
| Date | Close Price | Trend |
|---|---|---|
| 2026-05-15 | $408.63 | ▼ Down |
| 2026-05-14 | $403.92 | ▼ Down |
| 2026-05-13 | $406.55 | ▼ Down |
| 2026-05-12 | $424.17 | ▲ Up |
| 2026-05-11 | $421.00 | ▲ Up |
| 2026-05-08 | $420.12 | ▼ Down |
| 2026-05-07 | $428.68 | ▲ Up |
The EMA20 and EMA50 analysis suggests a downtrend pattern as EMA20 is below EMA50. The momentary upticks signal potential volatility and corrective phases. Investors should monitor these trends closely.
Support and Resistance
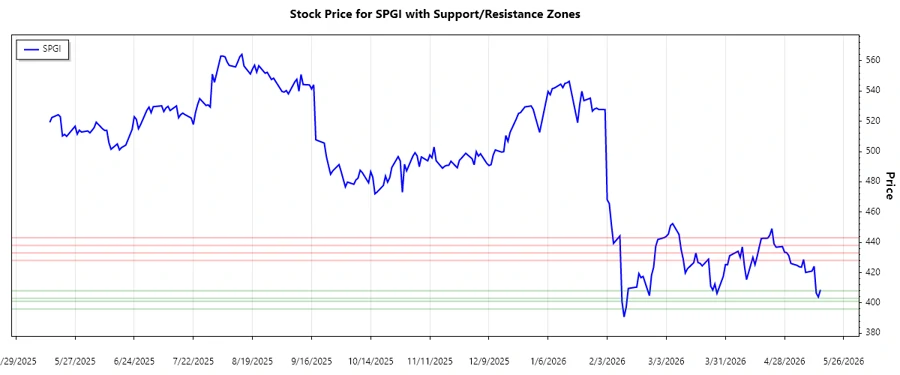
An examination of recent pricing data uncovers potential support and resistance zones crucial for informed investing strategies. The identified zones are:
| Zone Type | From ($) | To ($) | Direction |
|---|---|---|---|
| Support | 403.00 | 408.00 | ▲ Up |
| Support | 396.00 | 401.00 | ▼ Down |
| Resistance | 428.00 | 433.00 | ▼ Down |
| Resistance | 438.00 | 443.00 | ▲ Up |
The current price is near the lower support zone, indicating potential buying interest. However, the approach to resistance levels could signal seller presence. A break of these zones might predict directional shifts.
Conclusion
S&P Global Inc.'s recent downtrend with occasional upward corrections suggests a volatile phase with opportunities rooted in its well-established market presence. Analyst opinions should consider potential breaking points within current support and resistance zones. Understanding these technical indicators is essential for forecasting potential trends and developing strategic investment approaches under short-term and medium-term horizons.
Smart Data Insight
Master the Perfect Entry & Exit for this Stock
Don't leave your profits to chance. Historically, this stock follows specific seasonal patterns that institutional traders use to maximize returns.
- ✅ Identify the "Golden Buying Window"
- ✅ Avoid high-risk correction cycles
- ✅ Backtested data from the last 20+ years