February 14, 2026 a 04:03 am
SPGI: Trend and Support & Resistance Analysis - S&P Global Inc.
S&P Global Inc., a major player in providing valuable insights across various markets, has seen significant volatility in its stock price over recent months. Despite fluctuations, the overall trend suggests resilience in a rapidly changing economic landscape. Investors should consider both current market conditions and historical performance when evaluating potential investments in this stock.
Trend Analysis
| Date | Close Price | Trend |
|---|---|---|
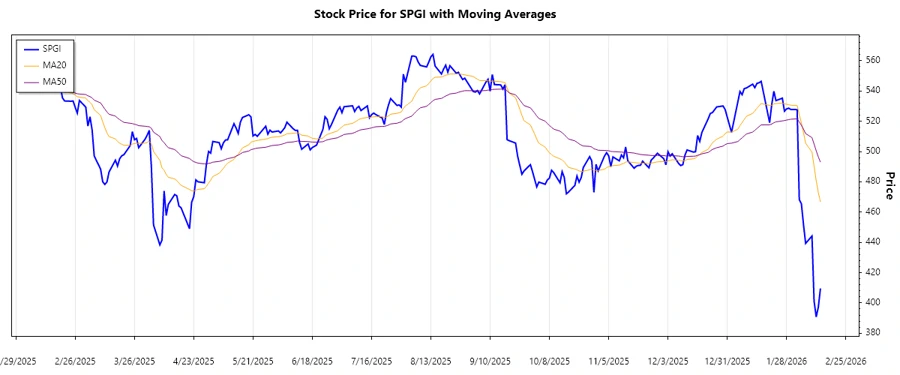
| 2026-02-13 | 409.54 | ▼ |
| 2026-02-12 | 397.20 | ▼ |
| 2026-02-11 | 390.76 | ▼ |
| 2026-02-10 | 401.08 | ▼ |
| 2026-02-09 | 444.19 | ▲ |
| 2026-02-06 | 439.28 | ▲ |
| 2026-02-05 | 451.71 | ▲ |
The most recent data suggests a prevalent downtrend in the stock price of S&P Global Inc., where EMA20 is less than EMA50 over the observed period. This indicates potential bearish sentiment, with prices declining over recent sessions.
Support and Resistance
| Zone Type | From | To |
|---|---|---|
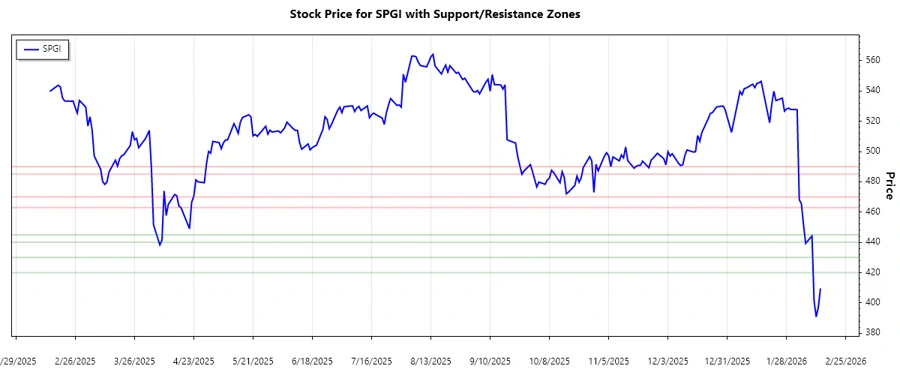
| Resistance 1 | 463.00 | 470.00 |
| Resistance 2 | 485.00 | 490.00 |
| Support 1 | 440.00 | 445.00 |
| Support 2 | 420.00 | 430.00 |
The current market price of S&P Global Inc.'s stock resides near the lower support zones. Investors might interpret this as a potential buying opportunity if supportive conditions persist, while resistance levels indicate areas of potential selling pressure if prices rise.
Conclusion
The analysis of S&P Global Inc. suggests a short-term bearish trend as reflected in the EMA indicators, despite the company's fundamentally stable business divisions. The support and resistance analysis provides strategic points for potential market entries and exits. Analysts might observe cautious optimism due to support zone proximity, offering resilience in faced economic unpredictability. Thus, suitable market positioning and risk management strategies are recommended to navigate the sector's volatility.