July 19, 2025 a 03:15 am

SPGI: Trend and Support & Resistance Analysis - S&P Global Inc.
S&P Global Inc. continues to demonstrate strong market presence through its comprehensive credit ratings and global indices, serving a diverse clientele across financial and commodity markets. Despite recent market fluctuations, the company’s diverse portfolio offers stability amid economic uncertainties. The stock shows potential for growth with inherent risks associated with market volatility. Careful monitoring of technical indicators is advisable for investment decisions.
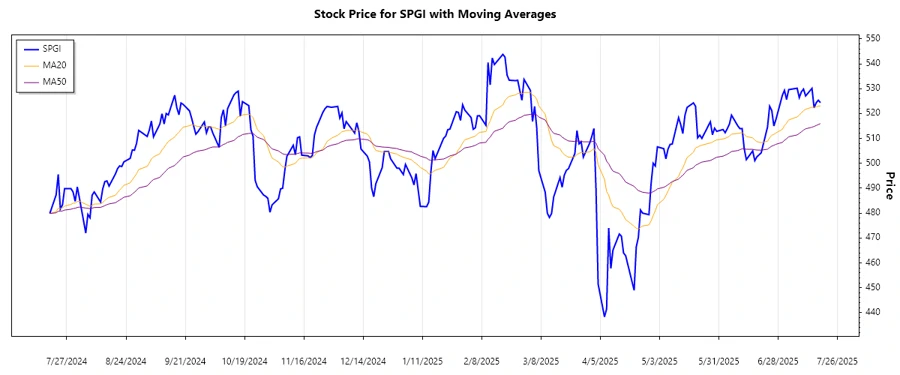
Trend Analysis
Analyzing the recent price data, the following trend observations are made based on the EMA calculations:
| Date | Close Price | Trend |
|---|---|---|
| 2025-07-18 | $524.38 | ▲ |
| 2025-07-17 | $525.36 | ▼ |
| 2025-07-16 | $524.36 | ⚖️ |
| 2025-07-15 | $522.28 | ▲ |
| 2025-07-14 | $530.12 | ▲ |
| 2025-07-11 | $527.07 | ▼ |
| 2025-07-10 | $529.83 | ▲ |
The analysis indicates a mixed trend with minor fluctuations around the EMAs. The technical stance suggests maintaining a cautious approach with a potential upward momentum.
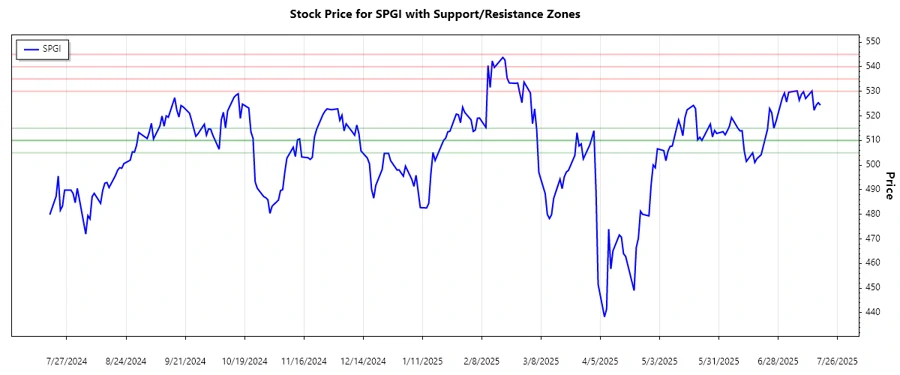
Support- and Resistance
Support and resistance zones are identified based on recent price action:
| Zone Type | Range | Direction |
|---|---|---|
| Support 1 | $510.00 - $515.00 | ▲ |
| Support 2 | $505.00 - $510.00 | ▲ |
| Resistance 1 | $530.00 - $535.00 | ▼ |
| Resistance 2 | $540.00 - $545.00 | ▼ |
The current price level is approaching the first resistance zone, which may pose a challenge to upward momentum if not breached. Technical caution is advised as price nears resistance.
Conclusion
The analysis of SPGI reveals a challenging market environment with potential growth opportunities. Navigating the high resistance levels will require resilience and strategic positioning. The reliance on diverse sectors offers a cushion against sector-specific downturns, presenting an attractive long-term prospect. Investors should remain vigilant to price movements nearing resistance and monitor EMAs for trend confirmation. The stock's performance will largely hinge on broader market sentiments and divisional performance analytics.
Smart Data Insight
Master the Perfect Entry & Exit for this Stock
Don't leave your profits to chance. Historically, this stock follows specific seasonal patterns that institutional traders use to maximize returns.
- ✅ Identify the "Golden Buying Window"
- ✅ Avoid high-risk correction cycles
- ✅ Backtested data from the last 20+ years