September 30, 2025 a 03:43 pm

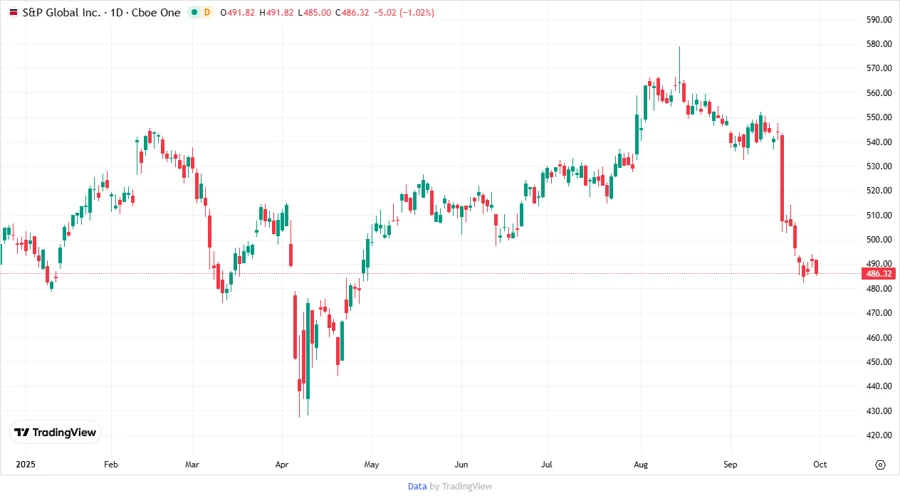
SPGI: Fundamental Ratio Analysis - S&P Global Inc.
S&P Global Inc. operates in diverse markets providing vital solutions ranging from credit ratings to data analytics. With a stable historical performance and a promising outlook in the financial services sector, SPGI remains a significant player in global capital markets.
Fundamentals Rating
The fundamental metrics for S&P Global Inc. indicate balanced performance with room for growth in several categories.
| Category | Score | Visualization |
|---|---|---|
| Discounted Cash Flow | 4 | |
| Return On Equity | 4 | |
| Return On Assets | 5 | |
| Debt To Equity | 3 | |
| Price To Earnings | 1 | |
| Price To Book | 1 |
Historical Rating
Analyzing these scores over time provides insight into SPGI's consistency and performance trends.
| Date | Overall Score | DCF | ROE | ROA | D/E | P/E | P/B |
|---|---|---|---|---|---|---|---|
| 2025-09-29 | 3 | 4 | 4 | 5 | 3 | 1 | 1 |
| N/A | 0 | 4 | 4 | 5 | 3 | 1 | 1 |
Analyst Price Targets
The consensus among analysts suggests a positive outlook, with the current median target set to sustain growth.
| High | Low | Median | Consensus |
|---|---|---|---|
| 599 | 407 | 550 | 517.82 |
Analysts' Sentiments
Most analysts provide a strong buy recommendation, reinforcing the positive sentiment surrounding SPGI.
| Recommendation | Number | Visualization |
|---|---|---|
| Strong Buy | 0 | |
| Buy | 23 | |
| Hold | 4 | |
| Sell | 0 | |
| Strong Sell | 0 |
Conclusion
Overall, S&P Global Inc. shows strong fundamentals with consistent historical performance across its various divisions. The analyst consensus suggests a promising future, mostly rating it a buy. However, the low scores in price-to-earnings and price-to-book ratios highlight areas that need attention. Investment decisions should consider potential market volatility and fluctuations in the financial sector. With extensive industry coverage and innovative solutions, SPGI is well-positioned for continued growth amidst global economic challenges.
Smart Data Insight
Master the Perfect Entry & Exit for this Stock
Don't leave your profits to chance. Historically, this stock follows specific seasonal patterns that institutional traders use to maximize returns.
- ✅ Identify the "Golden Buying Window"
- ✅ Avoid high-risk correction cycles
- ✅ Backtested data from the last 20+ years