March 20, 2026 a 03:15 pm
SPGI: Fibonacci Analysis - S&P Global Inc.
S&P Global Inc. (SPGI) has recently experienced a notable downtrend, characterized by a significant decrease in its stock price. With its diverse range of services, covering credit ratings, benchmarks, and market insights, SPGI remains a strong contender in the financial services sector. However, the recent downward movement suggests investor caution and potential market skepticism, inviting a closer technical analysis to identify future price movements.
Fibonacci Analysis
| Parameter | Details |
|---|---|
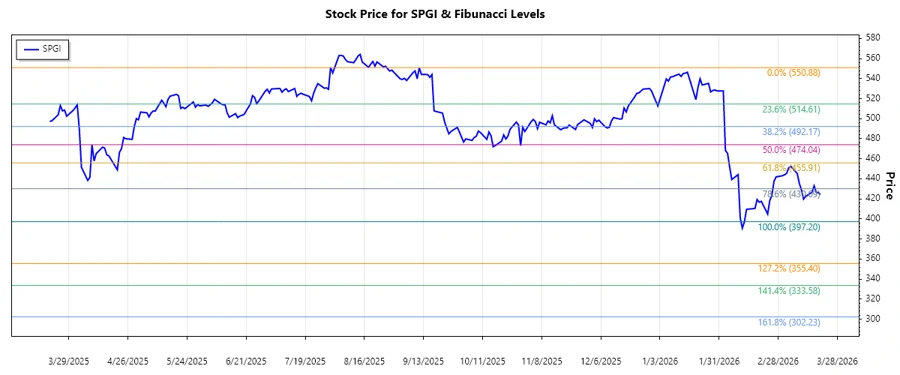
| Analysis Period | 2025-09-03 to 2026-03-20 |
| High Price | 550.88 on 2025-09-11 |
| Low Price | 397.2 on 2026-02-12 |
| Fibonacci Level 0.236 | 428.87 |
| Fibonacci Level 0.382 | 454.0 |
| Fibonacci Level 0.5 | 474.04 |
| Fibonacci Level 0.618 | 494.09 |
| Fibonacci Level 0.786 | 521.56 |
| Current Price | 424.41 |
| Current Retracement Zone | None |
| Technical Interpretation | The current price is below the 0.236 retracement level, suggesting that the price is nearing strong support levels. Investors should watch for potential bullish signals, indicating a possible price rebound. |
Conclusion
S&P Global Inc. is facing a challenging period, characterized by a significant downward trend over recent months. This decline in the stock's price poses both risks and opportunities for investors. The key Fibonacci levels indicate potential support or resistance in the future, offering insights for strategic entry or exit points. While the immediate outlook remains cautious, long-term investors may benefit from monitoring market conditions and SPGI's fundamental strengths in its industry.