November 18, 2025 a 12:46 pm


SPGI: Dividend Analysis - S&P Global Inc.
S&P Global Inc. demonstrates a robust dividend profile with a long history of consistent payments over 41 years. With a current dividend yield of around 0.79% and recent consistent growth, the stock may attract dividend-focused investors seeking stable returns. The company's prudent payout ratios suggest a healthy balance between rewarding shareholders and retaining capital for growth.
📊 Overview
S&P Global Inc. operates in the financial services sector with a notable reputation for providing essential insights and analytics. It consistently offers dividends, making it appealing to income investors.
| Aspect | Details |
|---|---|
| Sector | Financial Services |
| Dividend Yield | 0.79% |
| Current Dividend per Share | 3.64 USD |
| Dividend History | 41 years |
| Last Cut or Suspension | 2013 |
🗣️ Dividend History
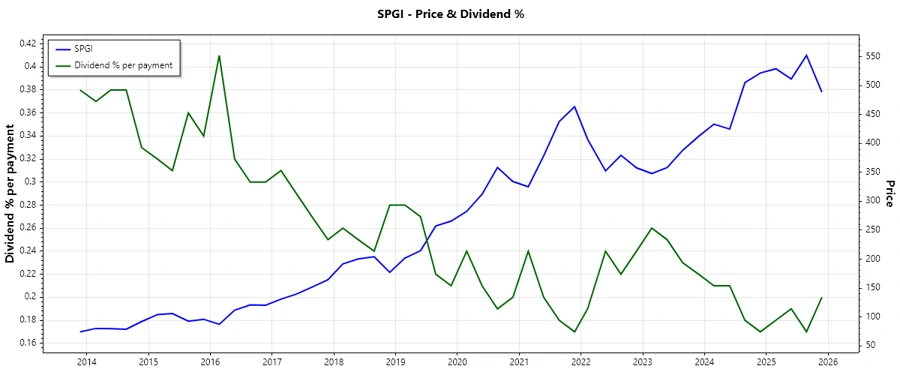
The dividend history of S&P Global showcases its commitment to returning value to shareholders. The absence of dividend cuts since 2013 underscores its strong financial health.
| Year | Dividend per Share (USD) |
|---|---|
| 2025 | 3.84 |
| 2024 | 3.64 |
| 2023 | 3.60 |
| 2022 | 3.32 |
| 2021 | 3.08 |
📈 Dividend Growth
With recent growth rates of 5.73% over three years and 9.81% over five years, S&P Global exhibits a commendable upward trend in dividend growth, indicating a stable income source for shareholders.
| Time | Growth |
|---|---|
| 3 years | 5.73% |
| 5 years | 9.81% |
The average dividend growth is 9.81% over 5 years. This shows moderate but steady dividend growth.
✅ Payout Ratio
Payout ratios are a crucial indicator of sustainability. S&P Global maintains a low EPS-based payout ratio of 26.82% and an FCF-based ratio of 20.18%, positioning it well for continued dividend stability.
| Key figure | Ratio |
|---|---|
| EPS-based | 26.82% |
| Free cash flow-based | 20.18% |
A low EPS payout ratio of 26.82% and an FCF ratio of 20.18% suggest that S&P Global retains significant earnings for growth and investment, mitigating risk to investors.
Cashflow & Capital Efficiency
Efficient capital management is reflected in the company's solid free cash flow and investments in capital expenditure.
| Metric | 2024 | 2023 | 2022 |
|---|---|---|---|
| Free Cash Flow Yield | 3.59% | 2.54% | 2.37% |
| Earnings Yield | 2.48% | 1.87% | 3.06% |
| CAPEX/Operating Cash Flow | 3.22% | 3.85% | 3.42% |
| Stock-based Compensation to Revenue | 1.74% | 1.37% | 1.91% |
| Free Cash Flow / Operating Cash Flow Ratio | 97.82% | 96.15% | 96.58% |
The company shows exceptional efficiency in capital utilization and cash flow management, supporting its ability to sustain and grow dividends.
Balance Sheet & Leverage Analysis
A healthy balance sheet with manageable leverage ratios is vital for financial stability in volatile markets.
| Metric | 2024 | 2023 | 2022 |
|---|---|---|---|
| Debt-to-Equity | 35.99% | 35.09% | 31.94% |
| Debt-to-Assets | 19.82% | 19.81% | 18.86% |
| Debt-to-Capital | 26.46% | 25.97% | 24.21% |
| Net Debt to EBITDA | 1.51x | 2.08x | 1.72x |
| Current Ratio | 0.97 | n/a | n/a |
| Quick Ratio | 0.85 | 0.84 | 0.94 |
| Financial Leverage | 1.82 | 1.77 | 1.69 |
The company maintains a good balance of debt, ensuring operational stability and financial flexibility for future growth.
Fundamental Strength & Profitability
Profitability metrics illuminate the operational effectiveness and profitability consistent with shareholder interests.
| Metric | 2024 | 2023 | 2022 |
|---|---|---|---|
| Return on Equity | 11.62% | 7.68% | 8.90% |
| Return on Assets | 6.40% | 4.33% | 5.26% |
| Net Margin | 27.11% | 21.01% | 29.05% |
| EBIT Margin | 39.45% | 32.05% | 44.77% |
| EBITDA Margin | 47.70% | 41.19% | 53.83% |
| Gross Margin | 69.09% | 66.86% | 66.43% |
| R&D to Revenue | 0% | 0% | 0% |
S&P Global displays solid profitability indicators, enhancing shareholder value through effective resource utilization and revenue retention.
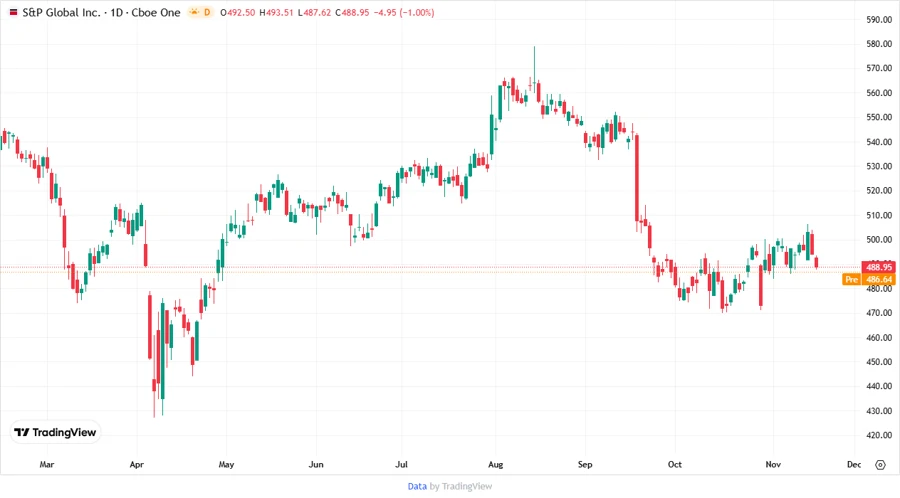
Price Development
✅ Dividend Scoring System
| Criteria | Score | Indicator |
|---|---|---|
| Dividend Yield | 3 | |
| Dividend Stability | 5 | |
| Dividend Growth | 4 | |
| Payout Ratio | 5 | |
| Financial Stability | 4 | |
| Dividend Continuity | 5 | |
| Cashflow Coverage | 4 | |
| Balance Sheet Quality | 4 |
Total Score: 34/40
⚠️ Rating
S&P Global Inc. offers a stable and promising dividend outlook for investors. With strong financial metrics supporting its dividend policy, the company is considered a reliable investment for those seeking steady income with potential for growth. The overall robust scoring suggests it remains a solid choice in an investor’s portfolio, particularly for those focused on long-term dividend income.
Smart Data Insight
Master the Perfect Entry & Exit for this Stock
Don't leave your profits to chance. Historically, this stock follows specific seasonal patterns that institutional traders use to maximize returns.
- ✅ Identify the "Golden Buying Window"
- ✅ Avoid high-risk correction cycles
- ✅ Backtested data from the last 20+ years