February 10, 2026 a 03:15 pm

SO: Fibonacci Analysis - The Southern Company
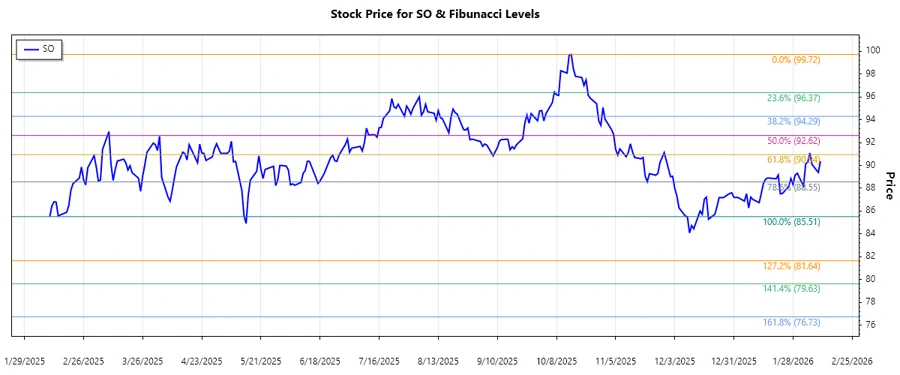
The Southern Company (SO) has been experiencing a downward trend over the analyzed period. The utilities sector company, known for its diverse operations from power generation to gas marketing, faces substantial market fluctuations. As of the data ending in February 2026, the company's stock price reflects this volatility, making the technical analysis crucial for investor decision-making.
Fibonacci Analysis
| Item | Description |
|---|---|
| Trend Start Date | 2025-10-15 |
| Trend End Date | 2026-02-10 |
| High Point | $99.72 at 2025-10-15 |
| Low Point | $85.51 at 2026-02-10 |
| Fibonacci 0.236 | $89.78 |
| Fibonacci 0.382 | $91.57 |
| Fibonacci 0.5 | $92.62 |
| Fibonacci 0.618 | $93.67 |
| Fibonacci 0.786 | $95.19 |
| Current Price Retracement | None |
| Technical Interpretation | The stock is currently below the 0.236 Fibonacci level, indicating continued downward momentum with possible support between the 0.236 and recent lows. |
Conclusion
The Southern Company’s stock has been on a downward trajectory since October 2025, reflecting external pressures in the utilities sector and internal business challenges. Investors should be cautious, as current price levels are below the significant Fibonacci retracement mark of 0.236, pointing towards potential for further declines. However, recovery potential exists if prices breach above the 0.236 level, providing room for gains. Analysts will closely monitor the company’s fundamental developments and sector trends to identify future support and resistance points.