
October 08, 2025 a 06:45 am

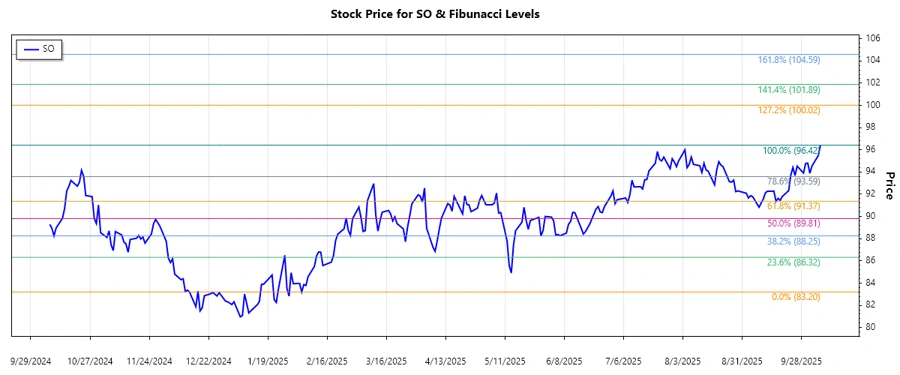
SO: Fibonacci Analysis - The Southern Company
The Southern Company has shown resilience in its stock performance reflected by its current uptrend. Its broad involvement in electricity generation and gas services provides stability, making it a reliable utility stock. Given renewable energy developments, further growth potential exists, aligning with industry advancements.
Fibonacci Analysis
| Item | Details |
|---|---|
| Start Date | 2025-02-04 |
| End Date | 2025-10-07 |
| High Point | $96.42 on 2025-10-07 |
| Low Point | $83.20 on 2025-02-04 |
| 0.236 Level | $86.99 |
| 0.382 Level | $88.67 |
| 0.5 Level | $89.81 |
| 0.618 Level | $90.95 |
| 0.786 Level | $92.64 |
| Current Price | $96.42 |
| Retracement Zone | None (Above all levels) |
| Technical Interpretation | The current price being above the 0.786 level suggests a strong uptrend continuation. The stock could encounter the next resistance once it hits the next Fibonacci extension levels. |
Conclusion
The Southern Company's stock is currently in an uptrend, validated by significant technical indicators and market confidence. Being above key Fibonacci levels suggests potential for further growth or stable performance near current levels. Risks include market volatility and regulatory changes in the energy sector. Opportunities lie in increased demand for renewable energy resources and technological advancements, making The Southern Company a viable option for cautious yet hopeful investors.
Smart Data Insight
Master the Perfect Entry & Exit for this Stock
Don't leave your profits to chance. Historically, this stock follows specific seasonal patterns that institutional traders use to maximize returns.
- ✅ Identify the "Golden Buying Window"
- ✅ Avoid high-risk correction cycles
- ✅ Backtested data from the last 20+ years