September 22, 2025 a 06:45 am
SO: Fibonacci Analysis - The Southern Company
The Southern Company, engaging in the generation and distribution of electricity and natural gas, shows a significant price movement within the considered timeframe. The technical analysis reveals an overall downward trend, with multiple market factors affecting its price. The company must navigate regulatory changes and fluctuating energy prices. Investors should consider these factors when evaluating The Southern Company's stock potential. This analysis uses Fibonacci levels to identify potential support and resistance zones.
Fibonacci Analysis
| Information | Details |
|---|---|
| Trend Start Date | 2024-10-24 |
| Trend End Date | 2025-09-19 |
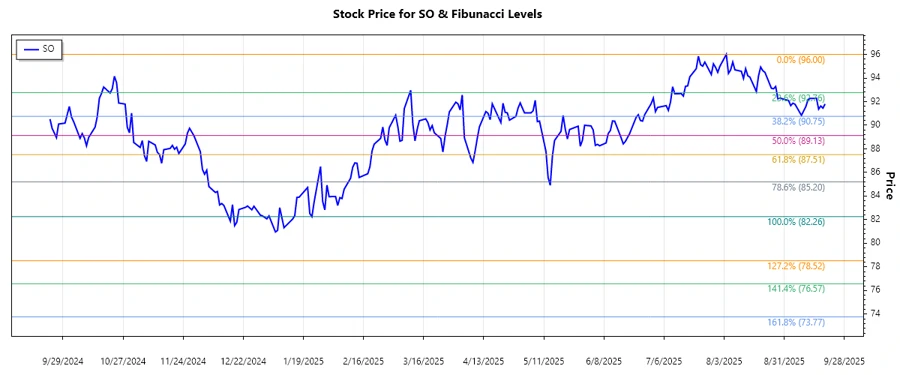
| High Price | $96.00 (2025-08-04) |
| Low Price | $82.26 (2025-01-23) |
| Fibonacci Level | Price Level |
|---|---|
| 0.236 | $85.91 |
| 0.382 | $88.77 |
| 0.5 | $90.65 |
| 0.618 | $92.53 |
| 0.786 | $95.04 |
The current price is $91.8, which is within the 0.618 retracement zone. This indicates possible resistance at this level. Should the price break above this level, it might signal further bullish momentum or consolidation around this area.
Conclusion
The Southern Company's stock faces pressures from broader market trends, yet opportunities arise from its diversification in combustion and renewable energy assets. The industrial energy sector's evolving landscape presents both hurdles and growth avenues. Traditionally stable, the company's handling of regulatory challenges and future project investments will be key. Currently, price behavior suggests testing important Fibonacci levels, needing careful monitoring for traders eyeing technical resistance shifts. Long-term investors should stay informed of institutional shifts and potential strategic realignments, any of which could impact valuation positively or negatively.
Smart Data Insight
Master the Perfect Entry & Exit for this Stock
Don't leave your profits to chance. Historically, this stock follows specific seasonal patterns that institutional traders use to maximize returns.
- ✅ Identify the "Golden Buying Window"
- ✅ Avoid high-risk correction cycles
- ✅ Backtested data from the last 20+ years