
June 20, 2026 a 12:46 pm
SO: Dividend Analysis - The Southern Company
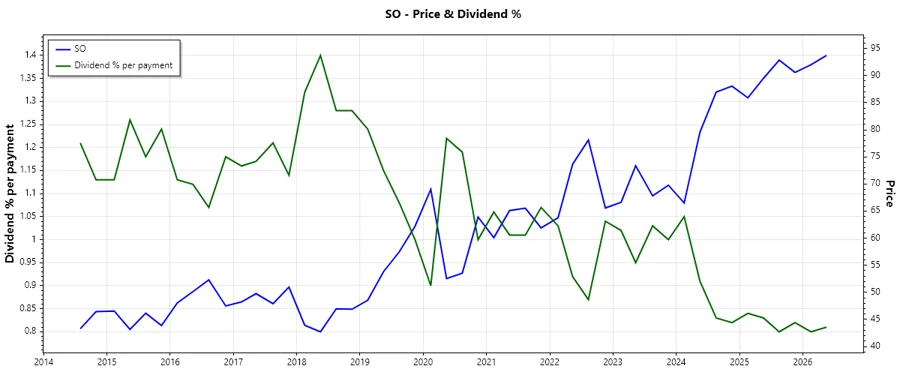
The Southern Company, a formidable force in the utilities sector, boasts a commendable dividend profile with a firm history of 45 consecutive years of dividend payouts. The company's stable dividend yield and resilient financials solidify its position as a reliable choice for dividend-focused investors. Despite minor fluctuations, The Southern Company maintains a consistent payout strategy, demonstrating robust shareholder commitment.
📊 Overview
The Southern Company operates within the utilities sector and provides an attractive dividend yield. With a strong track record of 45 years of dividend history and no recent cuts, it reflects a stable and predictable income for investors.
| Metric | Value |
|---|---|
| Sector | Utilities |
| Dividend yield | 3.18% |
| Current dividend per share | 2.73 USD |
| Dividend history | 45 years |
| Last cut or suspension | None |
🗣️ Dividend History
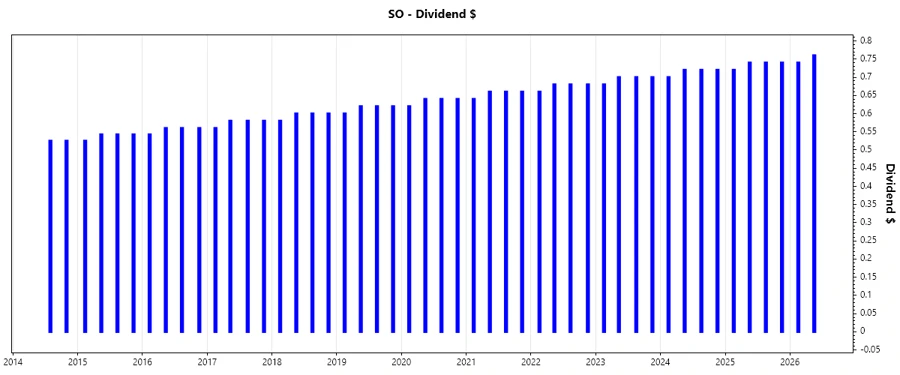
The Southern Company's commitment to maintaining its dividend payments is illustrated by its consistent history spanning over four decades. This stability is pivotal for investors seeking regularity and dependability in income generation.
| Year | Dividend per Share (USD) |
|---|---|
| 2026 | 1.50 |
| 2025 | 2.94 |
| 2024 | 2.86 |
| 2023 | 2.78 |
| 2022 | 2.70 |
📈 Dividend Growth
Analyzing the dividend growth is crucial as it indicates a company's ability to increase payouts over time, ensuring inflation-adjusted wealth preservation for shareholders. The Southern Company exhibits moderate and stable growth.
| Time | Growth |
|---|---|
| 3 years | 2.88% |
| 5 years | 2.97% |
The average dividend growth is 2.97% over 5 years, indicating moderate but steady dividend growth.
📉 Payout Ratio
Payout ratios provide insight into the sustainability of a company's dividend payments. High ratios may indicate potential future cuts, while low ratios suggest the ability to sustain or even increase dividends.
| Key figure | Ratio |
|---|---|
| EPS-based | 70.42% |
| Free cash flow-based | -81.58% |
The EPS payout ratio of 70.42% suggests a significant portion of earnings is distributed as dividends, aligning with industry norms. However, the negative FCF ratio highlights potential cash flow concerns that may influence future payout policies.
✅ Cashflow & Capital Efficiency
Understanding cash flow yield and capital efficiency metrics is critical in assessing a company's capability to generate sufficient cash from operations and manage its capital expenditures efficiently.
| Metric | 2025 | 2024 | 2023 |
|---|---|---|---|
| Free Cash Flow Yield | -3.05% | 0.92% | -2.01% |
| Earnings Yield | 4.51% | 4.88% | 5.19% |
| CAPEX to Operating Cash Flow | 1.29 | 0.91 | 1.20 |
| Stock-based Compensation to Revenue | 0.43% | 0.49% | 0.54% |
| Free Cash Flow / Operating Cash Flow Ratio | -29.94% | 8.51% | -20.42% |
The company's negative free cash flow yield in recent years suggests pressures in cash generation relative to market perception. Improvements in capital efficiency are necessary to bolster cash flow stability.
📊 Balance Sheet & Leverage Analysis
An examination of debt ratios and financial liquidity metrics informs an understanding of the company's financial stability and risk management.
| Metric | 2025 | 2024 | 2023 |
|---|---|---|---|
| Debt-to-Equity | 1.83 | 1.99 | 2.02 |
| Debt-to-Assets | 0.42 | 0.46 | 0.46 |
| Debt-to-Capital | 0.65 | 0.67 | 0.67 |
| Net Debt to EBITDA | 4.48 | 4.93 | 5.33 |
| Current Ratio | 0.65 | 0 | 0.77 |
| Quick Ratio | 0.45 | 0.46 | 0.53 |
| Financial Leverage | 4.32 | 4.37 | 4.43 |
The increasing debt ratios suggest a growing reliance on leverage, which may heighten financial risk unless countered by rising operational efficiency and cash flows.
📈 Fundamental Strength & Profitability
These metrics reflect the operational efficiency and profitability measures, helping gauge the company’s financial strength and potential for future growth.
| Metric | 2025 | 2024 | 2023 |
|---|---|---|---|
| Return on Equity | 12.05% | 13.25% | 12.64% |
| Return on Assets | 2.79% | 3.03% | 2.85% |
| Margins: Net | 14.68% | 16.47% | 15.74% |
| EBIT | 28.10% | 29.83% | 26.89% |
| EBITDA | 48.50% | 49.54% | 46.64% |
| Gross | 29.81% | 49.93% | 46.36% |
| R&D to Revenue | 0% | 0% | 0% |
The Southern Company maintains a solid profitability profile, underscored by strong EBITDA margins and satisfactory return on equity levels, indicative of good operational controls and market competitiveness.
📉 Price Development
✅ Dividend Scoring System
| Category | Score (1-5) | Score Bar |
|---|---|---|
| Dividend yield | 4 | |
| Dividend Stability | 5 | |
| Dividend growth | 3 | |
| Payout ratio | 3 | |
| Financial stability | 2 | |
| Dividend continuity | 5 | |
| Cashflow Coverage | 2 | |
| Balance Sheet Quality | 2 |
Total Score: 26/40
🗣️ Rating
The Southern Company presents a robust dividend proposition supported by its stability and long-standing history of regular payouts. While there are some concerns regarding cash flow coverage and debt levels, its steadfast commitment to dividends makes it an appealing choice for income-focused investors seeking sustainable dividend income. Our recommendation is a cautious hold, focusing on economic and operational improvements.
Smart Data Insight
Master the Perfect Entry & Exit for this Stock
Don't leave your profits to chance. Historically, this stock follows specific seasonal patterns that institutional traders use to maximize returns.
- ✅ Identify the "Golden Buying Window"
- ✅ Avoid high-risk correction cycles
- ✅ Backtested data from the last 20+ years