
April 08, 2026 a 11:31 am

SO: Dividend Analysis - The Southern Company
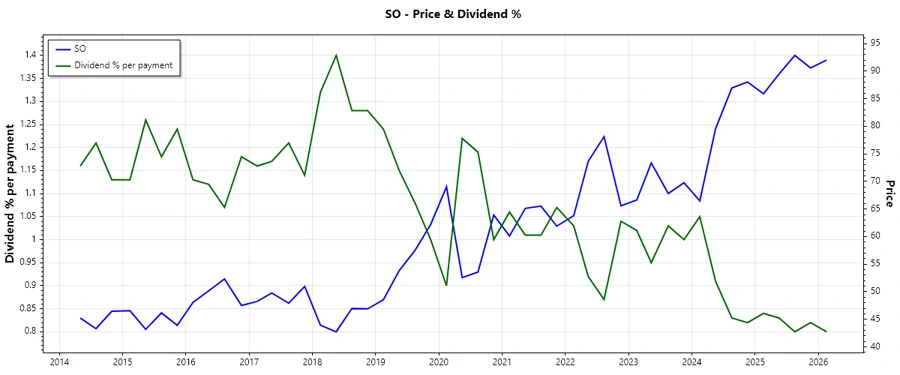
The Southern Company offers a compelling investment opportunity for dividend-focused investors with its consistent dividend history spanning 45 years, and current dividend yield of 3.22%. Despite challenges captured in negative free cash flow yields, the company maintains a strong dividend track record and offers a substantial yield for income-focused portfolios.
📊 Overview
The Southern Company operates in a stable sector with a focus on delivering reliable energy services. Its dividend yield and consistency are appealing, although the payout ratios indicate potential pressure points. The sector classification, combined with robust dividend yield, strengthens its profile for steady income.
| Key Metric | Detail |
|---|---|
| Sector | Energy |
| Dividend yield | 3.22 % |
| Current dividend per share | 2.73 USD |
| Dividend history | 45 years |
| Last cut or suspension | None |
🗣️ Dividend History
The Southern Company's extensive dividend history showcases a longstanding commitment to providing returns to shareholders. This track record bolsters confidence among shareholders about the firm's stability and reliability.
| Year | Dividend per Share |
|---|---|
| 2026 | 0.74 |
| 2025 | 2.94 |
| 2024 | 2.86 |
| 2023 | 2.78 |
| 2022 | 2.70 |
📈 Dividend Growth
The company has demonstrated moderate dividend growth over the last few years. While not aggressive, this growth reflects sustainable business practices and a focus on steady shareholder returns.
| Time | Growth |
|---|---|
| 3 years | 2.88 % |
| 5 years | 2.97 % |
The average dividend growth is 2.97 % over 5 years. This shows moderate but steady dividend growth.
📉 Payout Ratio
Payout ratios are crucial indicators of dividend sustainability. The current EPS payout ratio of 69.45 % is within a reasonable range, suggesting profits adequately cover dividends. However, the FCF payout ratio is negative, indicating potential concerns over cash flow sufficiency.
| Key figure | Ratio |
|---|---|
| EPS-based | 69.45 % |
| Free cash flow-based | -93.12 % |
While the EPS-based payout ratio suggests sustainable dividends, the negative FCF-based ratio implies liquidity challenges in funding these payments.
💵 Cashflow & Capital Efficiency
Assessing cash flow metrics reveals insight into operational efficiency and financial health. Free Cash Flow Yield, though negative, highlights potential strain on cash positions, while CapEx and stock-based compensations track investment and dilution aspects.
| Year | Free Cash Flow Yield | Earnings Yield | CAPEX to Operating Cash Flow | Stock-based Compensation to Revenue | Free Cash Flow / Operating Cash Flow Ratio |
|---|---|---|---|---|---|
| 2025 | -3.73 % | 4.51 % | 136.63 % | 0.46 % | -36.63 % |
| 2024 | 0.92 % | 4.88 % | 91.49 % | 0.49 % | 8.51 % |
| 2023 | -2.01 % | 5.19 % | 120.42 % | 0.54 % | -20.42 % |
The cash flow situation is challenging, with the negative Free Cash Flow Yield indicating insufficient coverage of operational cash demands by free cash flow. The high CapEx ratio may strain liquidity further.
🔍 Balance Sheet & Leverage Analysis
Understanding the company's leveraged positions is crucial. With a significant Debt-to-Equity ratio, The Southern Company possesses considerable financial obligations that may impact its operational flexibility. The current and quick ratios point toward tight liquidity.
| Year | Debt-to-Equity | Debt-to-Assets | Debt-to-Capital | Net Debt to EBITDA | Current Ratio | Quick Ratio |
|---|---|---|---|---|---|---|
| 2025 | 182.75 % | 42.27 % | 64.63 % | 4.48 | 0.00 | 44.91 % |
| 2024 | 199.58 % | 45.65 % | 66.62 % | 4.93 | 66.87 % | 45.80 % |
| 2023 | 201.91 % | 45.57 % | 66.88 % | 5.32 | 77.46 % | 52.57 % |
The company's high debt levels may pose risks if earnings or cash flows shrink. Careful management is essential to maintain financial stability.
📉 Fundamental Strength & Profitability
Profitability metrics, including Return on Equity and Margins, serve as indicators of operational performance. The Southern Company’s return metrics are moderate, reflecting its capability to generate profits from shareholder investments.
| Year | Return on Equity | Return on Assets | Net Profit Margin | Gross Margin | EBIT Margin | EBITDA Margin | R&D to Revenue |
|---|---|---|---|---|---|---|---|
| 2025 | 12.05 % | 2.79 % | 14.69 % | 29.81 % | 28.10 % | 48.50 % | 0.00 % |
| 2024 | 13.25 % | 3.03 % | 16.47 % | 49.93 % | 29.83 % | 49.54 % | 0.00 % |
| 2023 | 12.64 % | 2.85 % | 15.74 % | 46.36 % | 26.89 % | 46.64 % | 0.00 % |
Though profitability is generally stable, improvements could bolster The Southern Company’s financial resilience amid market fluctuations.
📊 Price Development
🗳️ Dividend Scoring System
| Category | Score (1-5) | Score Bar |
|---|---|---|
| Dividend yield | 4 | |
| Dividend Stability | 5 | |
| Dividend Growth | 3 | |
| Payout ratio | 3 | |
| Financial Stability | 3 | |
| Dividend Continuity | 5 | |
| Cashflow Coverage | 2 | |
| Balance Sheet Quality | 3 |
Total Score: 28/40
✅ Rating
The Southern Company stands out as a reliable dividend payer with stable historical performance. While some financial metrics pose challenges, especially regarding cash flow, its dividend continuity and yield remain attractive. Overall, it is recommended for investors seeking steady income, albeit with careful monitoring of cash flow trends and debt levels.
Smart Data Insight
Master the Perfect Entry & Exit for this Stock
Don't leave your profits to chance. Historically, this stock follows specific seasonal patterns that institutional traders use to maximize returns.
- ✅ Identify the "Golden Buying Window"
- ✅ Avoid high-risk correction cycles
- ✅ Backtested data from the last 20+ years