November 25, 2025 a 12:47 pm


SO: Dividend Analysis - The Southern Company
The Southern Company presents a compelling dividend profile with over four decades of consistent dividend history. With a current yield above 3% and a steady growth trajectory, this stock draws the attention of income-focused investors. Given the moderate payout ratios, the sustainability of dividends appears supported, albeit with certain concerns regarding cash flow consistency. Strategic investors might consider this stable utility firm, known for its resilience and predictable income stream.
📊 Overview
As a major player in the Utilities sector, The Southern Company offers an appealing dividend profile that combines stability with gradual growth. The company has sustained a dividend history over the decades, reinforcing its commitment to returning capital to shareholders.
| Indicator | Value |
|---|---|
| Sector | Utilities |
| Dividend yield | 3.25% |
| Current dividend per share | 2.70 USD |
| Dividend history | 44 years |
| Last cut or suspension | None |
🗣️ Dividend History
The Southern Company's impressive 44-year dividend history underscores its dedication to delivering reliable returns to shareholders. This long-term consistency enhances investor confidence and affirms the company's stability.
| Year | Dividend Per Share (USD) |
|---|---|
| 2025 | 2.94 |
| 2024 | 2.86 |
| 2023 | 2.78 |
| 2022 | 2.70 |
| 2021 | 2.62 |
📈 Dividend Growth
The historical dividend growth indicates continuous, albeit incremental, increases over the years, reflecting the company's systematic approach to enhancing shareholder value. Investors seeking growth alongside stability might find this appealing.
| Time | Growth |
|---|---|
| 3 years | 2.96% |
| 5 years | 3.06% |
The average dividend growth is 3.06% over 5 years. This shows moderate but steady dividend growth.
⚠️ Payout Ratio
An in-depth assessment of the payout ratios reveals a balanced approach to dividend payments in line with earnings, providing a cushion for the company against potential downturns while ensuring shareholder returns remain intact.
| Key figure | Ratio |
|---|---|
| EPS-based | 66.61% |
| Free cash flow-based | -148.35% |
The EPS-based payout ratio of 66.61% suggests a sustainable approach to dividends, however, the negative free cash flow payout ratio indicates that further monitoring of cash flows is necessary.
✅ Cashflow & Capital Efficiency
The cash flow metrics reflect certain volatility, especially given the negative free cash flow yield. Investors must consider these factors when evaluating the sustainability of dividends, as cash flow is integral to financial health.
| Metric | 2024 | 2023 | 2022 |
|---|---|---|---|
| Free Cash Flow Yield | 0.92% | -2.01% | -2.11% |
| Earnings Yield | 4.88% | 5.19% | 4.60% |
| CAPEX to Operating Cash Flow | 0.91% | 1.20% | 1.26% |
| Stock-based Compensation to Revenue | 0.49% | 0.54% | 0.43% |
| Free Cash Flow / Operating Cash Flow Ratio | 8.51% | -20.42% | -25.72% |
| Return on Invested Capital | 4.25% | 3.94% | 3.45% |
These figures illustrate mixed capital efficiency, with particular concerns about free cash flow. Profitability remains consistent, yet cash flow considerations remain critical for financial evaluation.
📉 Balance Sheet & Leverage Analysis
The current analysis reflects a substantial level of leverage, which is typical in the utilities sector. Investors should be mindful of the debt position and its potential impact on future growth and flexibility.
| Metric | 2024 | 2023 | 2022 |
|---|---|---|---|
| Debt-to-Equity Ratio | 2.00 | 2.02 | 1.94 |
| Debt-to-Assets Ratio | 0.46 | 0.46 | 0.44 |
| Debt-to-Capital Ratio | 0.67 | 0.67 | 0.66 |
| Net Debt to EBITDA | 4.93 | 5.33 | 5.55 |
| Current Ratio | 0.67 | 0.77 | 0.66 |
| Quick Ratio | 0.46 | 0.53 | 0.49 |
| Financial Leverage | 4.37 | 4.43 | 4.44 |
While leverage ratios are elevated, reflecting sector norms, they should be closely watched for any potential impact on refinancing or expansion capabilities.
✅ Fundamental Strength & Profitability
Consistency in profitability metrics such as return on equity suggests effective management practices. Keeping margins stable amid sector challenges highlights the company's operational efficiencies.
| Metric | 2024 | 2023 | 2022 |
|---|---|---|---|
| Return on Equity | 13.25% | 12.64% | 11.63% |
| Return on Assets | 3.03% | 2.85% | 2.62% |
| Net Margin | 16.47% | 15.75% | 12.07% |
| EBIT Margin | 29.83% | 26.89% | 21.33% |
| EBITDA Margin | 49.54% | 46.64% | 35.21% |
| Gross Margin | 49.93% | 46.36% | 36.30% |
| R&D to Revenue | 0% | 0% | 0% |
With satisfactory returns on equity and assets, coupled with robust margins, The Southern Company showcases its durability and adeptness in maintaining profitability in a demanding environment.
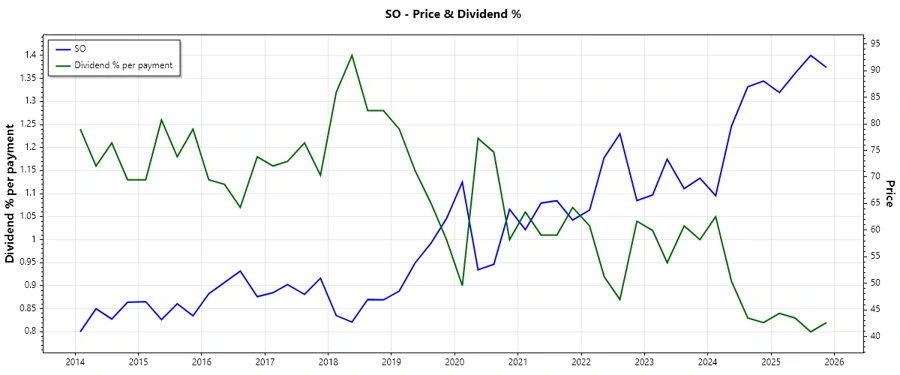
📈 Price Development
🗣️ Dividend Scoring System
| Criterion | Rating | Score |
|---|---|---|
| Dividend yield | 3.25% | |
| Dividend Stability | 44 years with no cuts | |
| Dividend growth | 3.06% | |
| Payout ratio | 66.61% EPS-based | |
| Financial stability | Leverage impact | |
| Dividend continuity | No suspensions | |
| Cashflow Coverage | Volatility noted | |
| Balance Sheet Quality | Highly leveraged |
Total Score: 32/40
📉 Rating
Concluding this dividend analysis, The Southern Company stands out for its enduring commitment to dividends amidst some cash flow concerns. With a dividend yield of over 3% and strong dividend stability, it remains a worthy consideration for income investors, particularly those valuing consistency and moderate growth. However, stakeholders must remain vigilant about the company's high leverage and the consequent potential impacts on financial flexibility.