
July 20, 2026 a 03:15 pm
SOLV: Fibonacci Analysis - Solventum Corporation
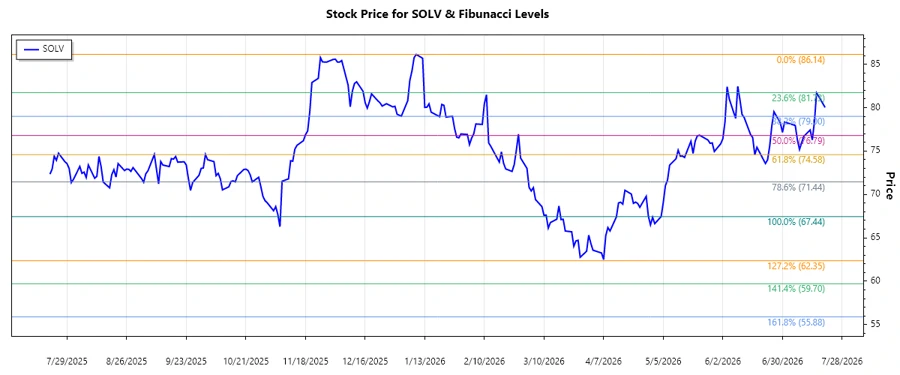
The Solventum Corporation has experienced a significant downtrend over the past several months. This trend has been marked by fluctuating demands in the healthcare sector, which has impacted its price dynamics. Investors are closely monitoring the technical retracement levels to evaluate potential entry and exit points for this stock.
Fibonacci Analysis
| Aspect | Details |
|---|---|
| Start Date | 2026-01-09 |
| End Date | 2026-07-20 |
| Lowest Price (Date) | $67.44 (2026-05-04) |
| Highest Price (Date) | $86.14 (2026-01-09) |
| Fibonacci Levels | Price Levels |
|---|---|
| 0.236 | $81.34 |
| 0.382 | $78.77 |
| 0.5 | $76.79 |
| 0.618 | $74.81 |
| 0.786 | $71.99 |
The current price is $80.025, which is hovering around the 0.236 retracement level, indicating a possible resistance point. Traders should consider this as a potential area for a reversal or a continuation of the current trend.
Conclusion
The Solventum Corporation's stock is under close technical scrutiny due to its significant correction from earlier highs. Current retracement levels suggest potential resistance, presenting both opportunities and challenges for investors. A break above these levels may signal an upward momentum increase, while failure to break through can lead to further downside risk. Thus, every move needs strategic decision-making. Investors should maintain a cautious stance while keeping an eye on emerging market trends and company developments.
Smart Data Insight
Master the Perfect Entry & Exit for this Stock
Don't leave your profits to chance. Historically, this stock follows specific seasonal patterns that institutional traders use to maximize returns.
- ✅ Identify the "Golden Buying Window"
- ✅ Avoid high-risk correction cycles
- ✅ Backtested data from the last 20+ years