May 23, 2026 a 06:44 am

SOLV: Fibonacci Analysis - Solventum Corporation
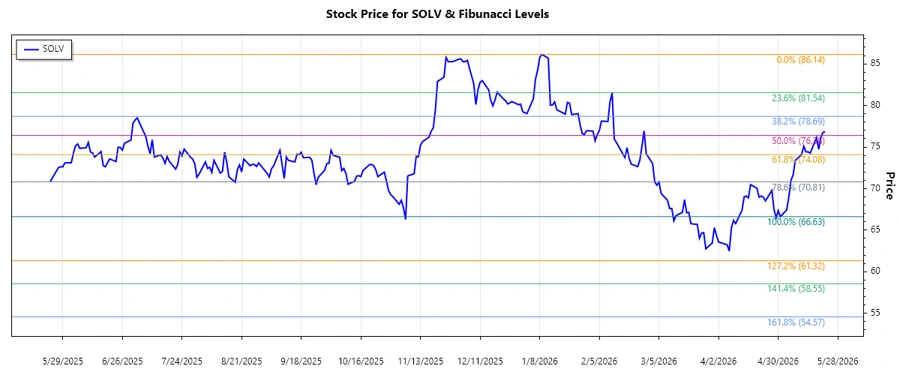
The Solventum Corporation's stock (SOLV) has shown a bearish trend over the last few months. Given the company's diverse business segments, this decline could indicate broader industry challenges or company-specific issues. Analyzing the recent market behavior, especially concerning its lower price range, can assist in identifying potential entry points for investors looking for turnaround opportunities.
Fibonacci Analysis
| Parameter | Details |
|---|---|
| Trend Duration | 2026-01-09 to 2026-05-22 |
| Highest Price (Date) | $86.14 (2026-01-09) |
| Lowest Price (Date) | $66.63 (2026-05-01) |
| Fibonacci Levels |
|
| Current Retracement Zone | 0.236 |
| Technical Interpretation | The current price level is within the 0.236 to 0.382 Fibonacci retracement zone, indicating potential support levels. A break below may suggest further downside risk, whereas a reversal could trigger a bullish slant. |
Conclusion
In conclusion, Solventum Corporation exhibits a significant downtrend, with the stock currently hovering around a critical retracement level. This suggests possible stabilization at these points unless market factors further pressure the price. Analysts may view this as an opportunity to observe any bullish triggers or prepare for potential declines. The healthcare sector's shifting dynamics could heavily influence SOLV’s future movements, making it vital for stakeholders to remain informed on sectoral changes. While potential exists, vigilance remains essential in navigating these uncertain waters.
Smart Data Insight
Master the Perfect Entry & Exit for this Stock
Don't leave your profits to chance. Historically, this stock follows specific seasonal patterns that institutional traders use to maximize returns.
- ✅ Identify the "Golden Buying Window"
- ✅ Avoid high-risk correction cycles
- ✅ Backtested data from the last 20+ years