April 25, 2026 a 04:44 pm

SOLV: Fibonacci Analysis - Solventum Corporation
Solventum Corporation, a versatile healthcare entity, has shown diverse engagement within its segments such as Medsurg and Dental Solutions. The stock, currently facing market scrutiny, demonstrates fluctuating trends influenced greatly by industry dynamics. Tracking its recent movements aids investors in discovering hidden opportunities or risks within its trading status.
Fibonacci Analysis
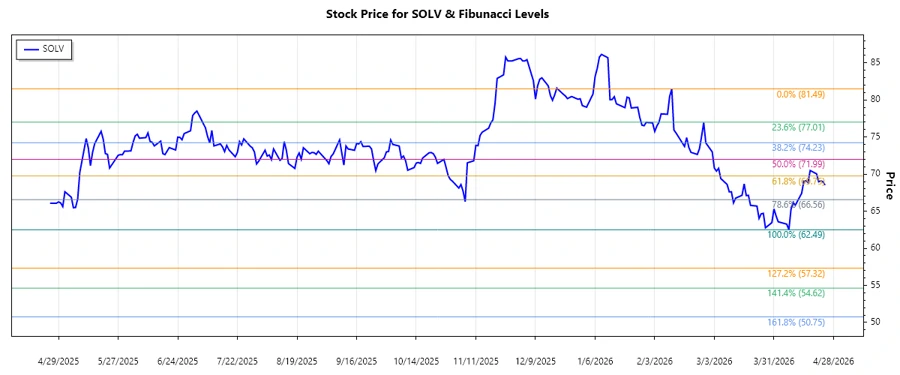
The analysis of Solventum Corporation's stock displays a dominant downtrend over the recent months. A peak was observed on February 11, 2026, with a high of $81.49, while a low was marked on April 7, 2026, at $62.49.
| Trend Start Date | Trend End Date | High Date | High Price | Low Date | Low Price |
|---|---|---|---|---|---|
| 2026-02-11 | 2026-04-07 | 2026-02-11 | 81.49 | 2026-04-07 | 62.49 |
Fibonacci Retracement Levels
| Retracement Level | Price Level |
|---|---|
| 23.6% | $67.42 |
| 38.2% | $70.02 |
| 50.0% | $72.99 |
| 61.8% | $75.96 |
| 78.6% | $79.62 |
Current analysis positions the stock in the retracement zone of 23.6%, suggesting potential resistance levels around $67.42.
This indicates a possible consolidation before further movements, offering opportunities for long-term strategic planning with a focus on potential breakouts or rebounds.
Conclusion
The current analysis suggests that the Solventum Corporation stock is navigating within a retracement phase. While the dominant downtrend can seem daunting for short-term strategies, the alignment within the 23.6% Fibonacci level offers potential for bounce-back or further declines. For analysts, a close examination of industry developments along with technical insights is crucial for forecast modeling. Assessing current price action against technical indicators is vital for determining entry and exit points.