February 10, 2026 a 10:15 am

SOLV: Fibonacci Analysis - Solventum Corporation
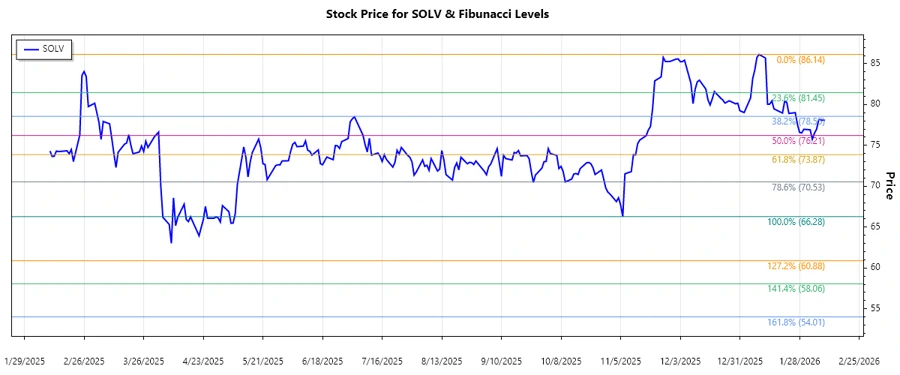
Solventum Corporation has demonstrated significant volatility in its stock values over the past months. The company's engagement in the healthcare sector, combined with its diverse segments ranging from Medsurg to Health Information Systems, makes it a compelling stock to watch. Recent trends suggest a dominant downtrend, possibly due to external macroeconomic factors affecting the healthcare industry. Investors should be cautious yet recognize potential buying opportunities if the stock approaches key support levels.
Fibonacci Analysis
| Trend Analysis | |
|---|---|
| Start Date: | 2025-11-05 |
| End Date: | 2026-02-09 |
| High Point: | $86.14 on 2026-01-09 |
| Low Point: | $66.28 on 2025-11-06 |
| Fibonacci Level | Price |
|---|---|
| 0.236 | $71.56 |
| 0.382 | $74.46 |
| 0.5 | $76.21 |
| 0.618 | $77.96 |
| 0.786 | $80.30 |
The current price of $78.07 suggests the stock is within the 0.618 Fibonacci retracement zone, indicating potential resistance at this level. A break above could signal a reversal, while continued resistance could suggest further downward movement.
Conclusion
The Solventum Corporation's stock currently finds itself in a technical consolidation within a key Fibonacci retracement level. While the diverse healthcare segments provide numerous opportunities, the stock's recent bearish trend suggests caution. For investors, this could signify a time to reassess investment strategies, with potential support below serving as a buy signal. Conversely, should the stock gain momentum and break past the Fibonacci resistance, it could be a precursor to an upward trend. Both opportunities and risks exist, depending on how the market reacts in the upcoming sessions.