June 02, 2026 a 09:03 am

SOLSV: Trend and Support & Resistance Analysis - Solstice Advanced Materials Inc. Common Stock When Issued
Solstice Advanced Materials Inc. operates in a multifaceted industry landscape, focusing on specialty materials for high-tech applications. Recent price trends suggest volatility but also potential for growth in innovative sectors like semiconductor manufacturing and alternative energy. This analysis will evaluate current market dynamics for SOLSV based on recent price movements and technical indicators.
Trend Analysis
Recent analysis of SOLSV shows varied stock price movements. Throughout the observed period, the Exponential Moving Averages (EMAs) help in assessing the trend outlook:
| Date | Close Price | Trend |
|---|---|---|
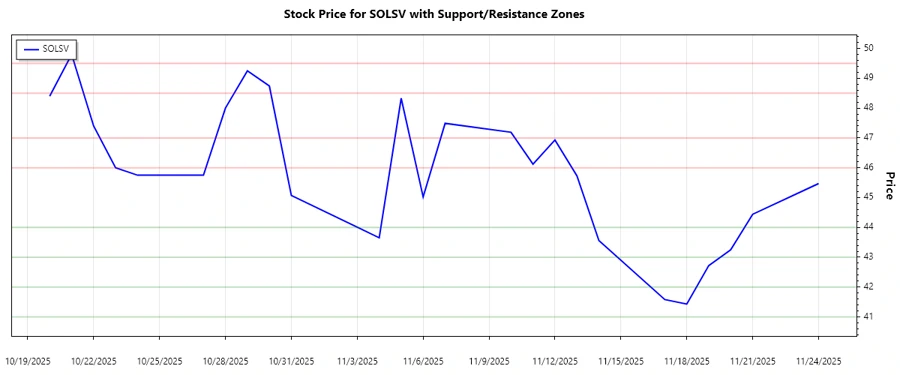
| 2025-11-24 | 45.47 | ▼ |
| 2025-11-21 | 44.44 | ▼ |
| 2025-11-20 | 43.25 | ▼ |
| 2025-11-19 | 42.72 | ▼ |
| 2025-11-18 | 41.43 | ▼ |
| 2025-11-17 | 41.58 | ▼ |
| 2025-11-14 | 43.56 | ▲ |
The above indicates a recent downtrend, with EMA20 < EMA50 suggesting bearish momentum. Caution is advised for traders expecting upward movement.

Support and Resistance
Critical support and resistance levels provide insight into potential price zones that may affect future movements:
| Zone Type | From | To |
|---|---|---|
| Support | 43.00 | 44.00 |
| Support | 41.00 | 42.00 |
| Resistance | 46.00 | 47.00 |
| Resistance | 48.50 | 49.50 |
The current stock price hovers near the lower support zone, indicating potential for a reversal or continued decline. Traders should observe these levels closely.
Conclusion
The analysis on Solstice Advanced Materials Inc. indicates prevalent market uncertainties with some bearish tendencies. While recent movements favor a downward trend, calculated risk assessment remains crucial. The observed support zones could provide a potential turnaround but also risk further declines. Resistance levels suggest future challenges in upward trajectory, but the potential lies in sector expansion and innovation. The stock is best approached with a balanced strategy considering both market conditions and the company's strategic growth potential.
Smart Data Insight
Master the Perfect Entry & Exit for this Stock
Don't leave your profits to chance. Historically, this stock follows specific seasonal patterns that institutional traders use to maximize returns.
- ✅ Identify the "Golden Buying Window"
- ✅ Avoid high-risk correction cycles
- ✅ Backtested data from the last 20+ years