
July 10, 2026 a 11:44 am
SOLSV: Fibonacci Analysis - Solstice Advanced Materials Inc. Common Stock When Issued
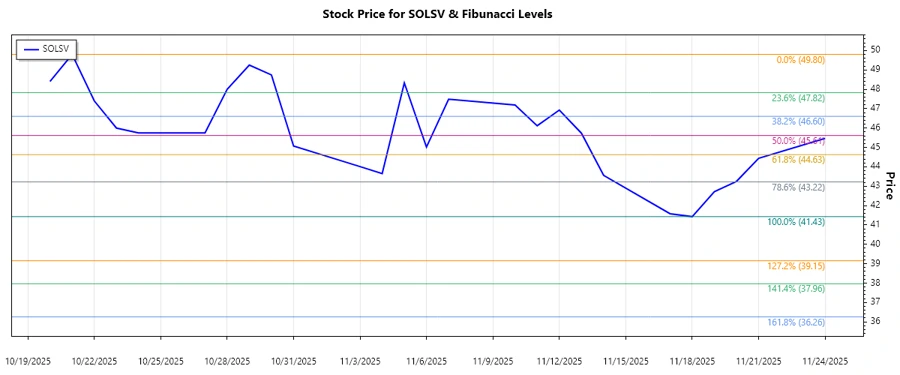
The stock of Solstice Advanced Materials Inc. has shown significant volatility over the recent months. It supports various critical sectors which bolsters its fundamental standing. Investors are closely monitoring technical indicators as the stock recently entered a retracement zone. Despite some market fluctuations, SOLSV holds potential due to its diversified portfolio.
Fibonacci Analysis
| Detail | Information |
|---|---|
| Trend Type | Down |
| Start Date | 2025-10-20 |
| End Date | 2025-11-24 |
| High Point (Price, Date) | $49.80, 2025-10-21 |
| Low Point (Price, Date) | $41.43, 2025-11-18 |
| Fibonacci Level | Price Level |
|---|---|
| 0.236 | $43.42 |
| 0.382 | $44.67 |
| 0.5 | $45.62 |
| 0.618 | $46.57 |
| 0.786 | $47.88 |
The current price level of $45.47 is within the 0.5 retracement zone. This suggests that the stock is potentially stabilizing at this Fibonacci level, and it could serve as a significant support zone. Investor decisions will be crucial in determining if the price maintains stability or tests lower retracement levels.
Conclusion
The downtrend identified in SOLSV's stock from late October to November 2025 presents both opportunities and risks for investors. The current position within the Fibonacci retracement provides a possible support level. Analysts see this as a crucial juncture for the stock, where further downward pressure could be resisted. However, investors must remain objective as volatility in the broader market can influence further movements. The dividend portfolio of Solstice heralds potential growth amid technical stabilization cues. Thus, while uncertainty looms, the technical setup offers promise for astute financial strategists.
Smart Data Insight
Master the Perfect Entry & Exit for this Stock
Don't leave your profits to chance. Historically, this stock follows specific seasonal patterns that institutional traders use to maximize returns.
- ✅ Identify the "Golden Buying Window"
- ✅ Avoid high-risk correction cycles
- ✅ Backtested data from the last 20+ years