
June 25, 2026 a 11:44 am
SOLSV: Fibonacci Analysis - Solstice Advanced Materials Inc. Common Stock When Issued
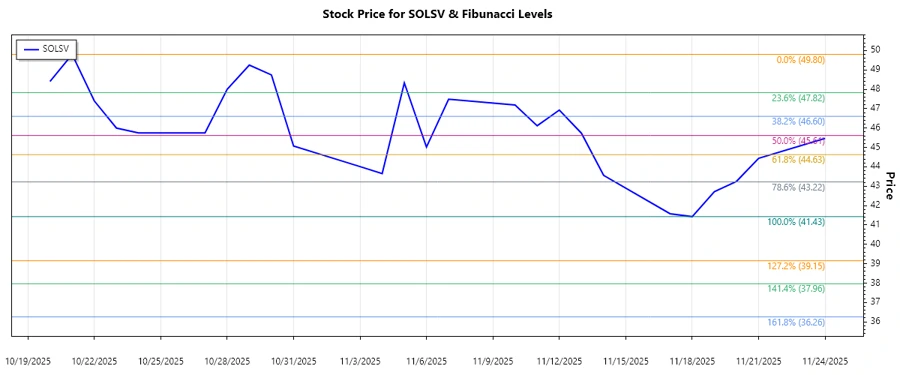
Solstice Advanced Materials Inc.'s stock has experienced varied movements over recent months, reflecting market responses to its diverse product portfolio and industry applications. The recent trend suggests potential opportunities, yet investors should approach with consideration of current sector dynamics. This analysis aims to highlight key technical levels to watch in the upcoming periods.
Fibonacci Analysis
| Parameter | Details |
|---|---|
| Trend Period | 2025-10-20 to 2025-11-24 |
| Highest Point | 49.8 on 2025-10-21 |
| Lowest Point | 41.43 on 2025-11-18 |
| Fibonacci Levels |
|
| Retracement Zone | Current price of $45.47 is in the 0.236 retracement zone. |
| Technical Interpretation | The stock is currently testing the 0.236 retracement level, indicating potential initial support. |
Conclusion
Solstice's stock remains pivotal within a 0.236 Fibonacci retracement, signaling a foundational support zone. Investors should consider the strategic placement of stop losses to mitigate risks as prices test these pivotal levels. Should the price consolidate or rebound from here, bullish opportunities may arise; however, a break below could indicate further bearish trends. Analysts should monitor broader market sentiments and company-specific developments for holistic assessments.
Smart Data Insight
Master the Perfect Entry & Exit for this Stock
Don't leave your profits to chance. Historically, this stock follows specific seasonal patterns that institutional traders use to maximize returns.
- ✅ Identify the "Golden Buying Window"
- ✅ Avoid high-risk correction cycles
- ✅ Backtested data from the last 20+ years