
July 15, 2026 a 06:44 am
SNPS: Fibonacci Analysis - Synopsys, Inc.
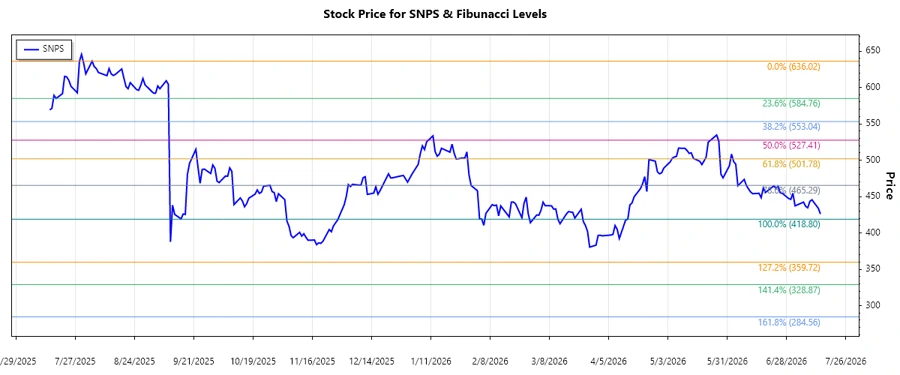
The analysis of Synopsys, Inc. (SNPS) shows a notable downtrend from July 2025 to July 2026. This period witnessed substantial price movements, highlighting challenges and opportunities in the stock's performance. Technical indicators and retracement levels can provide crucial insights into potential price movements and areas of support or resistance. Understanding these metrics is vital for making informed investment decisions in a volatile market.
Fibonacci Analysis
| Parameter | Details |
|---|---|
| Trend Period | From 2025-07-15 to 2026-07-14 |
| High Point | $636.02 on 2025-08-04 |
| Low Point | $418.8 on 2026-04-14 |
| Fibonacci Levels |
|
| Current Price Retracement | The current price of $425.9 is below all mentioned Fibonacci retracement levels, indicating it's not in any retracement zone. |
| Technical Interpretation | The current position below the Fibonacci levels suggests potential resistance and the possibility of further downward pressure. |
Conclusion
Synopsys, Inc. has demonstrated a significant downward trend over the past year, challenging investors and analysts. This decline highlights potential resistance levels around the identified Fibonacci retracement areas. Despite the recent lows, the stock may present opportunities for recovery if market conditions improve and technical indicators align favorably. However, continued caution is advised, as the price remains below critical retracement zones, suggesting further volatility. Investors must weigh risks against potential rewards, considering both fundamental and technical factors. The outlook for Synopsys hinges on both market dynamics and operational performance in navigating this complex landscape.
Smart Data Insight
Master the Perfect Entry & Exit for this Stock
Don't leave your profits to chance. Historically, this stock follows specific seasonal patterns that institutional traders use to maximize returns.
- ✅ Identify the "Golden Buying Window"
- ✅ Avoid high-risk correction cycles
- ✅ Backtested data from the last 20+ years