September 18, 2025 a 10:16 am

SNPS: Fibonacci Analysis - Synopsys, Inc.
Synopsys, Inc. specializes in electronic design automation software, catering to a wide range of industries from electronics to automotive. The company's stock (SNPS) has experienced a significant upward trend in recent months. As a key player in the tech sector, the stock is sensitive to technological advancements and market dynamics. Investors should monitor this trend as Synopsys continues to deliver innovation in chip design.
Fibonacci Analysis
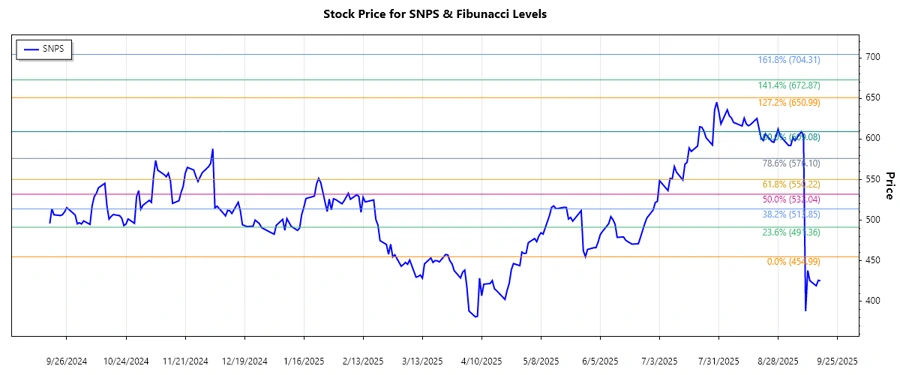
The analysis focuses on the identified upward trend observed in SNPS. Using the highest and lowest price points within this trend, Fibonacci levels are calculated to assess potential support and resistance areas.
| Category | Details |
|---|---|
| Trend Start Date | 2025-05-29 |
| Trend End Date | 2025-09-09 |
| High Point | $609.08 on 2025-09-08 |
| Low Point | $454.99 on 2025-05-29 |
| Fibonacci Levels |
|
| Retracement Zone | 0.236 - Current price is at $425.4 |
| Technical Interpretation | The stock is moving below the 23.6% retracement level, indicating potential support at this zone. If the support holds, a possible rebound could occur. |
Conclusion
Synopsys, Inc. shows a robust upward trend with few corrections, suggesting bullish sentiment among investors. The current retracement could serve as a healthy pause within an ongoing uptrend. However, caution is warranted as technical support levels are tested. Continued monitoring of price action around these Fibonacci levels is advisable to gauge potential market directions. The stock's activity reflects the broader tech sector's volatility and opportunities, making it a critical observation point for investors seeking growth in the expanding field of electronic design automation.
Smart Data Insight
Master the Perfect Entry & Exit for this Stock
Don't leave your profits to chance. Historically, this stock follows specific seasonal patterns that institutional traders use to maximize returns.
- ✅ Identify the "Golden Buying Window"
- ✅ Avoid high-risk correction cycles
- ✅ Backtested data from the last 20+ years