December 14, 2025 a 03:15 pm
SNA: Fibonacci Analysis - Snap-on Incorporated
Snap-on Incorporated, a leading manufacturer in the tools and equipment sector, has recently shown strong upward momentum in its stock price. Backed by robust demand across its product segments, the company appears well-positioned to capitalize on ongoing industry growth. Investors are advised to watch for potential retracements that could offer entry opportunities in this ascending market phase.
Fibonacci Analysis
| Aspect | Details |
|---|---|
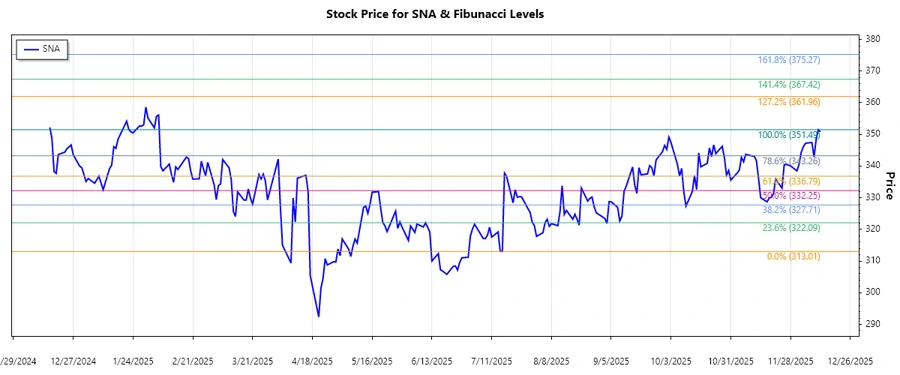
| Trend Start Date | 2025-07-16 |
| Trend End Date | 2025-12-12 |
| High Point (Price/Date) | $351.49 / 2025-12-11 |
| Low Point (Price/Date) | $313.01 / 2025-07-16 |
| Fibonacci Levels |
|
| Current Price Position | The current price is around $350.83, near the previous high, suggesting limited retracement. |
| Technical Interpretation | The price nearing the previous high indicates potential resistance. A breakthrough could lead to new highs, whereas failure may prompt a pullback. |
Conclusion
Snap-on Incorporated’s recent price action reflects a robust bullish trend, driven by steady performance across its diversified business lines. The stock's proximity to its highest levels indicates strong market sentiment, yet also a potential overbought condition. Analysts should weigh the risk of a pullback against possible breakout opportunities, particularly as the stock tests upper resistance boundaries. A strategic approach may involve watching for confirmed breakouts or retracements to initiate or increase positions. Overall, Snap-on’s continued expansion and resilience position it favorably in the current market landscape.
JSON representation: