November 06, 2025 a 05:15 am
SNA: Fibonacci Analysis - Snap-on Incorporated
Snap-on Incorporated has shown robust performance in the tools and equipment sector. Over recent months, the stock has demonstrated a consistent uptrend, reflecting investor confidence and strong market positioning. The company’s diverse product offerings and strategic market expansion contribute to its positive outlook. As the stock currently approaches key technical levels, attention to potential retracement zones could be crucial for traders.
Fibonacci Analysis
| Details | Information |
|---|---|
| Start Date | 2024-11-06 |
| End Date | 2025-11-05 |
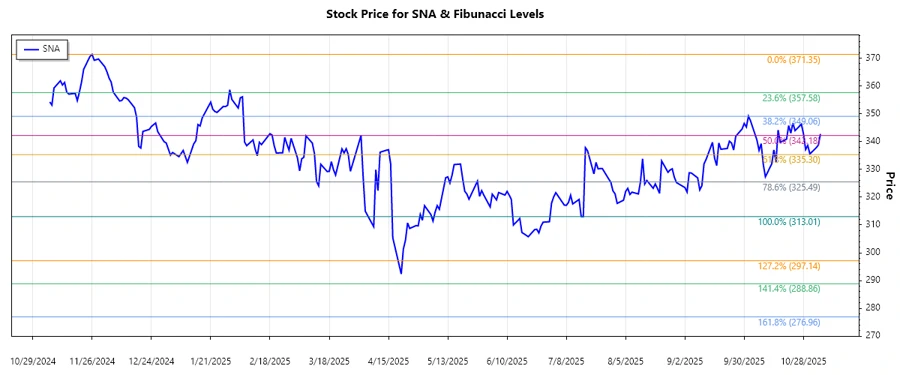
| High | $371.35 (2024-11-26) |
| Low | $313.01 (2025-07-16) |
| Fibonacci Level | Price |
|---|---|
| 0.236 | $328.65 |
| 0.382 | $339.97 |
| 0.5 | $342.18 |
| 0.618 | $344.38 |
| 0.786 | $355.28 |
The current price is $342.75, placing it within the 0.5 Fibonacci retracement zone. This typically indicates a strong support level, suggesting possible continuation of the existing uptrend if held.
Conclusion
The Fibonacci retracement analysis of Snap-on Incorporated suggests that the stock is currently experiencing a strong support near the 0.5 level. Maintaining this support could provide an opportunity for further upward movement, whereas slipping below could imply increased downside risk. Analysts might see it as a zone of potential accumulation or support validation. Investors should weigh potential macroeconomic factors and company-specific news that could impact price stability. As trends evolve, staying informed on technical levels and retracements remains crucial.
Smart Data Insight
Master the Perfect Entry & Exit for this Stock
Don't leave your profits to chance. Historically, this stock follows specific seasonal patterns that institutional traders use to maximize returns.
- ✅ Identify the "Golden Buying Window"
- ✅ Avoid high-risk correction cycles
- ✅ Backtested data from the last 20+ years