
April 19, 2026 a 02:46 am

SNA: Dividend Analysis - Snap-on Incorporated
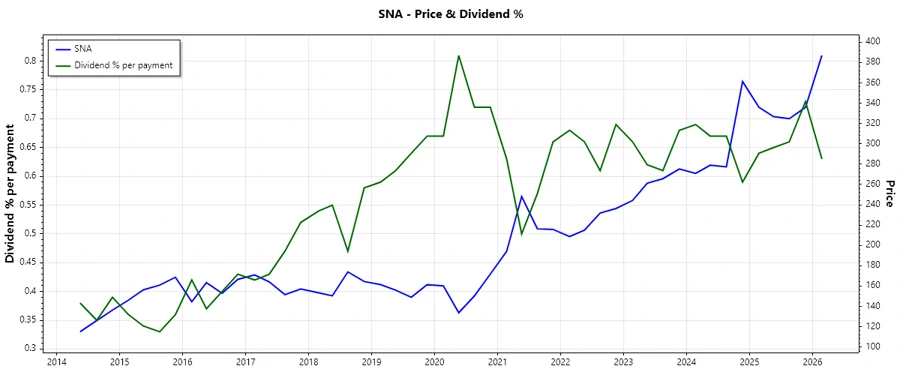
Snap-on Incorporated exhibits a robust dividend profile backed by a longstanding dividend history and sustainable payout ratios. The company's dividend yield of 2.37% is competitive, paired with a historical growth in payouts. Snap-on demonstrates efficient capital management, reflecting healthy financial metrics that support continuous dividend distributions.
📊 Overview
Snap-on Incorporated operates in a sector characterized by moderate to stable dividend yields. With a dividend yield of 2.37%, and a current dividend per share of $8.87, the company shows an impressive 42-year history of uninterrupted dividend payments, with no recent cuts or suspensions.
| Metric | Value |
|---|---|
| Sector | Industrial Tools & Equipment |
| Dividend yield | 2.37% |
| Current dividend per share | $8.87 |
| Dividend history | 42 years |
| Last cut or suspension | None |
🗣️ Dividend History
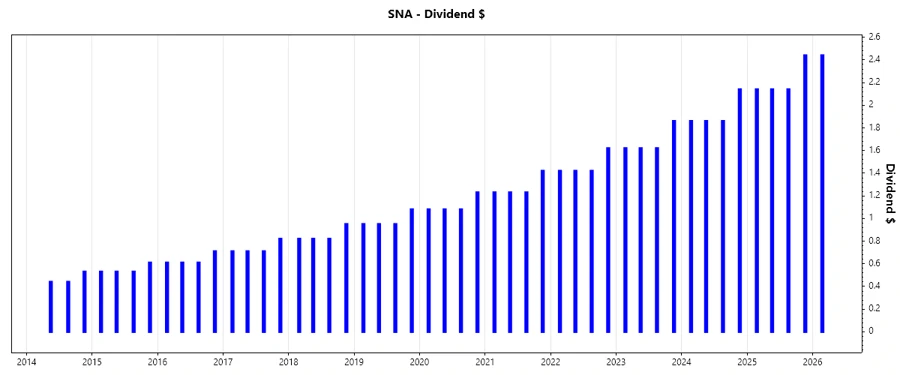
The sustained dividend payments over 42 years reflect the company's strong financial health and dedication to returning profits to shareholders. This historical consistency underscores the reliability of Snap-on's dividends.
| Year | Dividend Per Share |
|---|---|
| 2026 | $2.44 |
| 2025 | $8.86 |
| 2024 | $7.72 |
| 2023 | $6.72 |
| 2022 | $5.88 |
📈 Dividend Growth
Snap-on exhibits a favorable dividend growth rate, supporting its position as a consistent dividend payer. The growth rates are strong indicators of the company’s financial stability and profitability prospects.
| Time | Growth |
|---|---|
| 3 years | 14.64% |
| 5 years | 14.67% |
The average dividend growth is 14.67% over 5 years. This shows moderate but steady dividend growth.
⚖️ Payout Ratio
Payout ratios provide insight into how much of the company's earnings and free cash flows are used for dividend payments, reflecting financial sustainability and management's confidence in the cash flow situation.
| Key figure | Ratio |
|---|---|
| EPS-based | 45.28% |
| Free cash flow-based | 45.92% |
The EPS payout ratio of 45.28% and FCF payout ratio of 45.92% suggest a balanced approach to shareholder returns and retained earnings for future growth.
💰 Cashflow & Capital Efficiency
Cashflow analysis reveals the operational efficiency and financial health of Snap-on, shedding light on its ability to generate cash and utilize capital efficiently.
| Metric | 2025 | 2024 | 2023 |
|---|---|---|---|
| Free Cash Flow Yield | 5.50% | 6.28% | 6.93% |
| Earnings Yield | 5.56% | 5.78% | 6.62% |
| CAPEX to Operating Cash Flow | 7.03% | 6.86% | 8.23% |
| Stock-based Compensation to Revenue | 0.00% | 0.56% | 0.88% |
| Free Cash Flow / Operating Cash Flow Ratio | 92.97% | 93.14% | 91.77% |
Snap-on's data showcases effective capital deployment, consistent free cash flow generation and a strong ability to cover capital expenditures.
📉 Balance Sheet & Leverage Analysis
Analyzing the balance sheet ratios provides insight into Snap-on’s financial leverage, and the company’s capacity to meet its long-term obligations.
| Metric | 2025 | 2024 | 2023 |
|---|---|---|---|
| Debt-to-Equity | 22.36% | 23.97% | 25.21% |
| Debt-to-Assets | 15.77% | 16.37% | 16.95% |
| Debt-to-Capital | 18.27% | 19.33% | 20.14% |
| Net Debt to EBITDA | -0.20 | -0.04 | 0.19 |
| Current Ratio | 4.79 | 4.15 | 3.88 |
| Quick Ratio | 3.68 | 3.17 | 2.81 |
| Financial Leverage | 1.42 | 1.46 | 1.49 |
The company's low leverage ratios and high liquidity point to a sound financial footing, providing assurance in its short-term financial stability and long-term debt management.
🏤 Fundamental Strength & Profitability
Profitability ratios delineate Snap-on's effectiveness in using assets to generate earnings, allowing for a comprehensive understanding of its financial performance.
| Metric | 2025 | 2024 | 2023 |
|---|---|---|---|
| Return on Equity | 17.14% | 19.35% | 19.94% |
| Return on Assets | 12.09% | 13.22% | 13.40% |
| Net Margin | 19.72% | 20.43% | 19.79% |
| EBIT Margin | 26.89% | 27.85% | 26.97% |
| EBITDA Margin | 28.80% | 29.77% | 28.92% |
| Gross Margin | 51.73% | 51.97% | 51.28% |
| R&D to Revenue | 0.00% | 0.00% | 0.00% |
Snap-on’s profitability and efficient utilization of equities manifest in its high returns on equity and assets, enhancing its attractiveness as an investment opportunity.
📈 Price Development
🎯 Dividend Scoring System
| Criterion | Score (1-5) | |
|---|---|---|
| Dividend yield | 4 | |
| Dividend Stability | 5 | |
| Dividend growth | 4 | |
| Payout ratio | 4 | |
| Financial stability | 5 | |
| Dividend continuity | 5 | |
| Cashflow Coverage | 5 | |
| Balance Sheet Quality | 5 |
Total Score: 37/40
✅ Rating
Snap-on Incorporated holds a commendable dividend profile, making it a compelling choice for dividend-seeking investors. Its robust divestiture policy, combined with consistent earnings and prudent financial management, renders it a reliable stock offering moderate capital appreciation coupled with secure income prospects.
Smart Data Insight
Master the Perfect Entry & Exit for this Stock
Don't leave your profits to chance. Historically, this stock follows specific seasonal patterns that institutional traders use to maximize returns.
- ✅ Identify the "Golden Buying Window"
- ✅ Avoid high-risk correction cycles
- ✅ Backtested data from the last 20+ years