June 05, 2025 a 11:31 am

SNA: Dividend Analysis - Snap-on Incorporated
Snap-on Incorporated, a leader in the industrial sector, stands as a prominent choice for investors seeking stable income streams. The company boasts a consistent dividend history, marked by 41 years of consecutive payments. With a robust market cap of $16.7 billion, Snap-on is well-positioned to maintain its dividend commitments while exploring growth opportunities.
Overview 📊
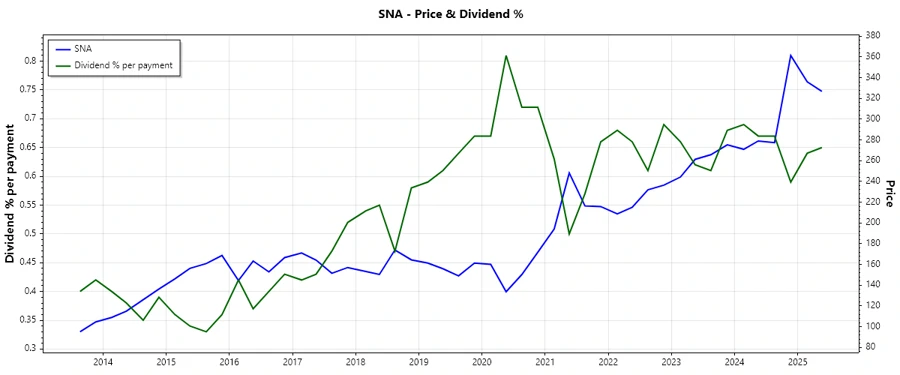
The dividend profile of Snap-on Incorporated underscores its commitment to rewarding shareholders. The company offers a solid dividend yield of 2.53%, alongside a steady dividend growth trajectory.
| Metric | Details |
|---|---|
| Sector | Industrial |
| Dividend yield | 2.53% |
| Current dividend per share | $7.73 USD |
| Dividend history | 41 years |
| Last cut or suspension | None |
Dividend History 📈
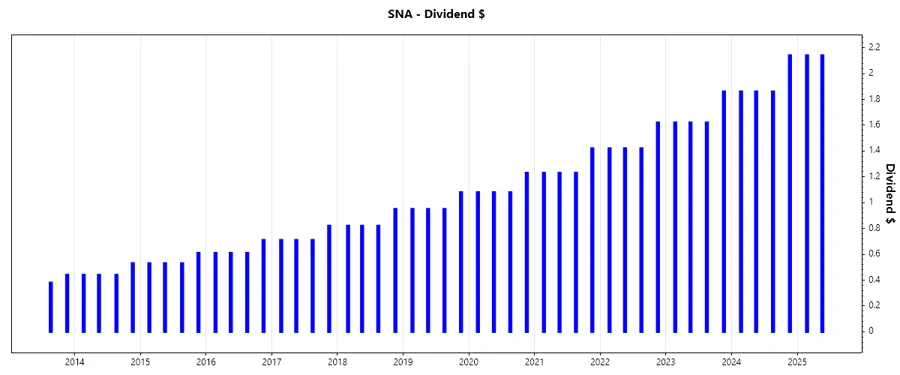
Snap-on's dividend history reflects an impressive 41 consecutive years of annual payments. This sustained payout record affirms the company's financial stability and commitment to returning capital to shareholders.
| Year | Dividend Per Share (USD) |
|---|---|
| 2025 | $4.28 |
| 2024 | $7.72 |
| 2023 | $6.72 |
| 2022 | $5.88 |
| 2021 | $5.11 |
Dividend Growth 📈
Growth in dividends is a critical parameter for investors seeking compounding returns. Snap-on exhibits moderate dividend growth, showcasing its adaptability and dynamic business model.
| Time | Growth |
|---|---|
| 3 years | 0.15% |
| 5 years | 0.14% |
The average dividend growth is 0.14% over 5 years. This shows moderate but steady dividend growth.
Payout Ratio ⚠️
The payout ratio provides insight into dividend sustainability. Snap-on's payout ratios, based on both EPS and free cash flow, illustrate a healthy balance between reinvesting earnings and returning capital to shareholders.
| Key figure | Ratio |
|---|---|
| EPS-based | 39.66% |
| Free cash flow-based | 37.32% |
With payout ratios at 39.66% (EPS) and 37.32% (FCF), Snap-on maintains a responsible and potential-enhancing dividend policy.
Cashflow & Capital Efficiency ✅
Efficient cash flow management is paramount for sustaining dividends and fueling growth. Snap-on's free cash flow yield and Earnings Yield reflect its operational adeptness.
| Year | 2024 | 2023 | 2022 |
|---|---|---|---|
| Free Cash Flow Yield | 6.28% | 6.93% | 4.86% |
| Earnings Yield | 5.78% | 6.62% | 7.50% |
| CAPEX to Operating Cash Flow | 7.25% | 8.23% | 12.47% |
| Stock-based Compensation to Revenue | 0.60% | 0.88% | 0.76% |
| Free Cash Flow / Operating Cash Flow Ratio | 93.14% | 91.77% | 87.53% |
Snap-on exhibits strong cash flow stability and capital efficiency, indicating robust financial management and reinvestment potential.
Balance Sheet & Leverage Analysis 🏦
Assessing leverage ratios and balance sheet health is critical for evaluating liquidity risks and financial flexibility. Snap-on maintains a conservative debt profile, ensuring operational agility.
| Year | 2024 | 2023 | 2022 |
|---|---|---|---|
| Debt-to-Equity | 0.24 | 0.25 | 0.28 |
| Debt-to-Assets | 0.16 | 0.17 | 0.18 |
| Debt-to-Capital | 0.19 | 0.20 | 0.22 |
| Net Debt to EBITDA | -0.04 | 0.19 | 0.36 |
| Current Ratio | 4.15 | 3.88 | 3.47 |
Snap-on's favorable leverage ratios highlight its strong financial health, minimizing default risk and enhancing its creditworthiness.
Fundamental Strength & Profitability 📈
Snap-on's fundamental ratios portray its robust profitability and operational efficiency, essential for sustainable growth and shareholder value creation.
| Year | 2024 | 2023 | 2022 |
|---|---|---|---|
| Return on Equity | 19.35% | 19.94% | 20.34% |
| Return on Assets | 13.22% | 13.40% | 13.08% |
| Net Margin | 22.18% | 19.79% | 20.29% |
| EBIT Margin | 30.22% | 26.97% | 27.82% |
| Research & Development to Revenue | 0% | 1.27% | 1.34% |
Snap-on's profitability metrics are indicative of its competitive edge, assuring shareholders of consistent value enhancement.
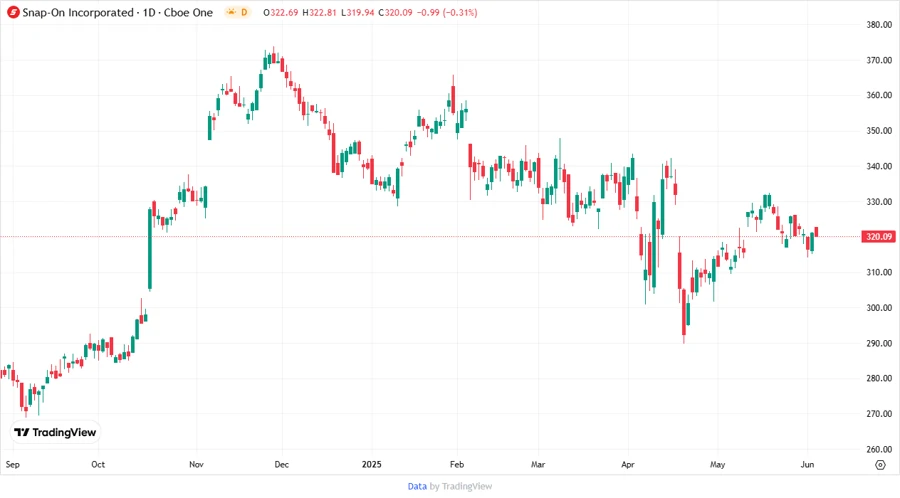
Price Development 🗣️
Dividend Scoring System ✅
| Criteria | Description | Score |
|---|---|---|
| Dividend yield | A healthy yield indicative of periodic income. | 3/5 |
| Dividend Stability | 41 years of consecutive payments. | 4/5 |
| Dividend growth | Steady growth record. | 3/5 |
| Payout ratio | Conservative, sustaining reinvestment & growth. | 4/5 |
| Financial stability | Strong balance sheet management. | 4/5 |
| Dividend continuity | Consistent dividend issuance. | 5/5 |
| Cashflow Coverage | Dependable cash flow coverages. | 4/5 |
| Balance Sheet Quality | Resilient leverage and equity ratios. | 5/5 |
Total Score: 32/40
Rating 🗣️
Snap-on Incorporated warrants a positive dividend rating, balancing attractive yields and solid fundamentals. It remains a reliable dividend payer with potential for consistent shareholder returns amid its strong market positioning and prudent financial strategies.
Smart Data Insight
Master the Perfect Entry & Exit for this Stock
Don't leave your profits to chance. Historically, this stock follows specific seasonal patterns that institutional traders use to maximize returns.
- ✅ Identify the "Golden Buying Window"
- ✅ Avoid high-risk correction cycles
- ✅ Backtested data from the last 20+ years