
July 05, 2026 a 02:03 pm


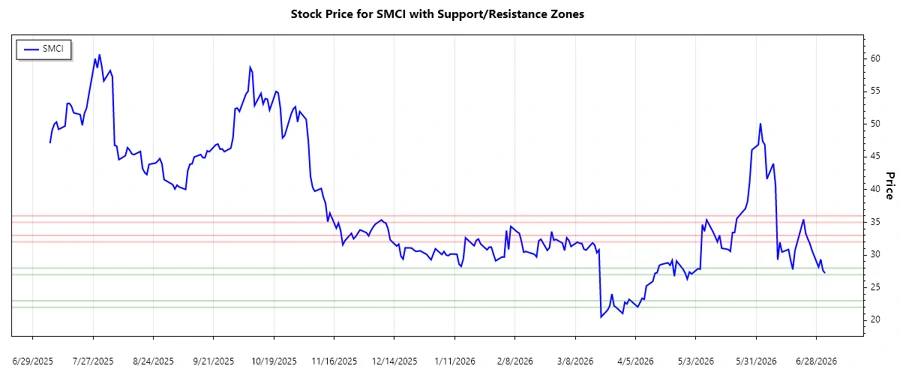
SMCI: Trend and Support & Resistance Analysis - Super Micro Computer, Inc.
Super Micro Computer, Inc. showcases a dynamic market presence driven by its innovative server and storage solutions. Over the past few months, the stock has exhibited notable fluctuations, reflecting the market's response to its expansion into AI and cloud computing sectors. Despite recent volatility, the technical landscape offers potential opportunities for investors who monitor key support and resistance zones.
Trend Analysis
Recent analysis of daily closing prices suggests that Super Micro Computer, Inc.'s stock has traversed a volatile path. Using the EMA20 and EMA50 calculations, current trends can be identified.
| Date | Closing Price | Trend |
|---|---|---|
| 2026-07-02 | 27.22 | ▼ Abwärtstrend |
| 2026-07-01 | 27.65 | ▼ Abwärtstrend |
| 2026-06-30 | 29.33 | ▼ Abwärtstrend |
| 2026-06-29 | 28.15 | ▼ Abwärtstrend |
| 2026-06-26 | 30.63 | ▼ Abwärtstrend |
| 2026-06-25 | 31.68 | ▼ Abwärtstrend |
| 2026-06-24 | 32.45 | ▼ Abwärtstrend |
The computed EMA20 and EMA50 have shown that the stock is in a dominant downtrend. The EMA20 is positioned below the EMA50, indicating ongoing bearish momentum. Technical indicators suggest market caution is advised.
Support and Resistance
Analyzing prior data trends has outlined specific support and resistance zones crucial for upcoming movements in Super Micro Computer, Inc.'s stock.
| Zone Type | From | To |
|---|---|---|
| Support 1 | 27.00 | 28.00 |
| Support 2 | 22.00 | 23.00 |
| Resistance 1 | 32.00 | 33.00 |
| Resistance 2 | 35.00 | 36.00 |
Current stock prices indicate it hovers near the lower support zone. If support breaks, potential downside risk increases, but an upward bounce could mark a reversal.
Conclusion
Super Micro Computer, Inc. presents an intriguing case for analysis given current market pressures and technological advancements. The stock is currently in a downtrend, aligning with broader market sentiments. While support levels offer potential buy zones, breaking support may lead to further declines, whereas holding them could suggest a recovery phase is on the horizon. Investors should conduct thorough due diligence and stay abreast of market developments to capitalize on potential opportunities. The volatility presents both risk and reward, emphasizing the importance of strategic entry and exit points.
Smart Data Insight
Master the Perfect Entry & Exit for this Stock
Don't leave your profits to chance. Historically, this stock follows specific seasonal patterns that institutional traders use to maximize returns.
- ✅ Identify the "Golden Buying Window"
- ✅ Avoid high-risk correction cycles
- ✅ Backtested data from the last 20+ years