March 13, 2026 a 03:15 pm**SMCI: Fibonacci Analysis - Super Micro Computer, Inc.**
 **Fibonacci Analysis**
Based on recent pricing data, SMCI's stock has shown a dominant downward trend.
**Fibonacci Analysis**
Based on recent pricing data, SMCI's stock has shown a dominant downward trend.
**Calculated Fibonacci Levels**
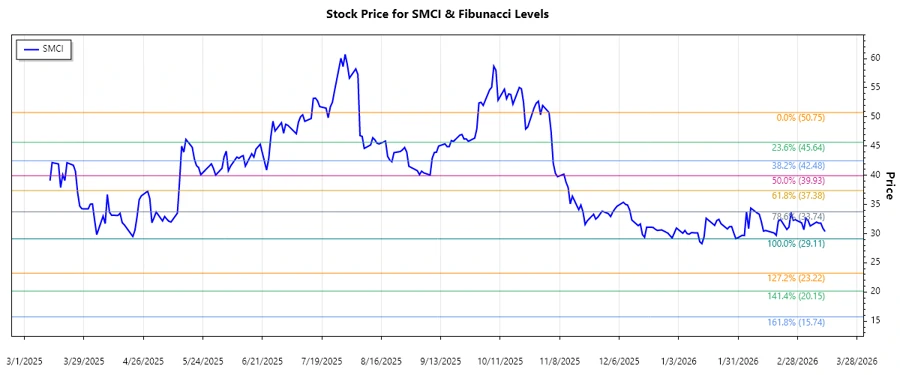
The current stock price is around $30.36, falling within the 0.786 Fibonacci retracement level. This suggests that the stock might be testing the lower level as potential support, which is crucial for traders considering entry points or affirming continuation patterns in the prevailing trend.
 **Conclusion**
In conclusion, SMCI has encountered a significant downward trend, suggesting caution for investors and traders. Given its current position within the Fibonacci retracement levels, this may indicate a pivotal moment where the stock might find support or continue its downward path if breached. Understanding these metrics is imperative for leveraging opportunities and mitigating potential risks in trading strategies. The trend emphasizes the importance of staying informed about market movements and recognizing technical indicators' role in financial forecasting.
**Conclusion**
In conclusion, SMCI has encountered a significant downward trend, suggesting caution for investors and traders. Given its current position within the Fibonacci retracement levels, this may indicate a pivotal moment where the stock might find support or continue its downward path if breached. Understanding these metrics is imperative for leveraging opportunities and mitigating potential risks in trading strategies. The trend emphasizes the importance of staying informed about market movements and recognizing technical indicators' role in financial forecasting.
Super Micro Computer, Inc.'s stock has experienced significant shifts over recent months. It operates in a challenging yet promising environment, delivering high-performance server and storage solutions. With fluctuating prices, analyzing recent trends using technical analysis tools such as Fibonacci retracement provides insights into potential support and resistance levels critical for informed decision-making.
| Parameter | Details |
|---|---|
| Trend Start Date | 2025-11-03 |
| Trend End Date | 2026-03-13 |
| High Price | $50.75 (2025-11-03) |
| Low Price | $29.11 (2026-01-30) |
| Fibonacci Level | Price Level ($) |
|---|---|
| 0.236 | 43.12 |
| 0.382 | 39.54 |
| 0.5 | 36.93 |
| 0.618 | 34.32 |
| 0.786 | 31.26 |
**Conclusion**
In conclusion, SMCI has encountered a significant downward trend, suggesting caution for investors and traders. Given its current position within the Fibonacci retracement levels, this may indicate a pivotal moment where the stock might find support or continue its downward path if breached. Understanding these metrics is imperative for leveraging opportunities and mitigating potential risks in trading strategies. The trend emphasizes the importance of staying informed about market movements and recognizing technical indicators' role in financial forecasting.