August 23, 2025 a 05:15 am
SMCI: Fibonacci Analysis - Super Micro Computer, Inc.
Super Micro Computer, Inc. (SMCI) has shown a significant price movement over the last few months. Analyzing the overall trend helps investors understand potential support and resistance levels. The data suggests the importance of monitoring key levels for informed trading decisions.
Fibonacci Analysis
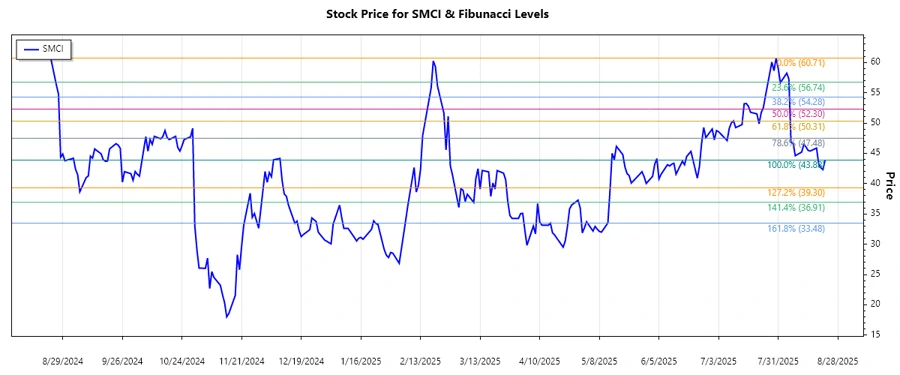
The latest data for SMCI indicates a dominant downtrend from April 2025 to August 2025. The highest closing price during this period was on July 30, 2025, and the lowest on August 22, 2025. Calculating Fibonacci retracement levels provides insights into possible support areas where the asset might retrace before potentially resuming its prior trend.
| Start Date | End Date | High Price | High Date | Low Price | Low Date |
|---|---|---|---|---|---|
| 2025-04-01 | 2025-08-22 | $60.71 | 2025-07-30 | $43.88 | 2025-08-22 |
| Fibonacci Level | Price Level |
|---|---|
| 0.236 | $56.40 |
| 0.382 | $54.35 |
| 0.5 | $52.30 |
| 0.618 | $50.25 |
| 0.786 | $47.73 |
The current price of SMCI is positioned within the 0.786 retracement zone. A break significantly above or below this level may indicate either a continuation of the downtrend or a possible reversal.
An interpretation suggests that traders should watch the 0.786 level closely, as it can serve as a potential support zone in the short term.
Conclusion
The Fibonacci retracement analysis on SMCI highlights critical levels that could impact future price movements. While the stock trades near the 0.786 level, investors should be cautious and monitor for signals of either reversal or trend continuation. Potential challenges include navigating volatility and macroeconomic influences. However, the identification of current support levels may offer opportunities for strategic entry or exit points for investors.
Smart Data Insight
Master the Perfect Entry & Exit for this Stock
Don't leave your profits to chance. Historically, this stock follows specific seasonal patterns that institutional traders use to maximize returns.
- ✅ Identify the "Golden Buying Window"
- ✅ Avoid high-risk correction cycles
- ✅ Backtested data from the last 20+ years