
June 17, 2026 a 11:44 am
SLB: Fibonacci Analysis - SLB N.V.
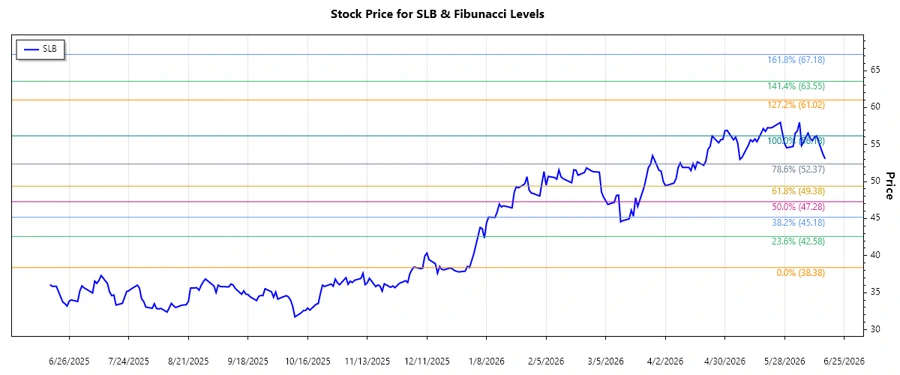
The SLB N.V. stock has shown significant volatility over the analyzed months, reflecting its dynamic involvement in the energy sector. The most recent trend suggests a dominant upward movement, which could be indicative of positive investor sentiment toward the company's strategic initiatives in energy technology. Given its breadth of services, including well construction and reservoir performance, SLB N.V. is positioned to leverage current market trends, though investors should remain cautious of energy market fluctuations.
Fibonacci Analysis
The data indicates a significant uptrend from late 2025 to mid-2026. This uptrend showcases investor optimism or positive developments within SLB N.V. Here's the detailed Fibonacci retracement analysis of the observed trend:
| Trend Analysis Information | Data |
|---|---|
| Start Date | 2025-12-31 |
| End Date | 2026-06-16 |
| High Point | $56.18 on 2026-06-12 |
| Low Point | $38.38 on 2025-12-31 |
The calculated Fibonacci levels are as follows:
| Retracement Level | Price |
|---|---|
| 0.236 | $45.82 |
| 0.382 | $49.69 |
| 0.5 | $52.28 |
| 0.618 | $54.87 |
| 0.786 | $57.78 |
Currently, the price is at $53.07, which places it above the 0.5 retracement level, suggesting it could be encountering resistance at the 0.618 level.
The analysis suggests potential resistance around the $54.87 price level, crucial for investors to observe as it could either repel the price downwards or break through into further gains.
Conclusion
In conclusion, SLB N.V.'s stock demonstrates robust growth potential, with recent uptrends signifying strong movements possibly due to strategic initiatives within the company. The Fibonacci retracement analysis indicates current price levels that might act as significant resistance or support, impacting future movements. Investors should consider both global energy market dynamics and SLB's technological advancements when evaluating the stock. Opportunities lie in breakthroughs past resistance levels, whereas risks align with potential downward retracements amidst market volatility.
Smart Data Insight
Master the Perfect Entry & Exit for this Stock
Don't leave your profits to chance. Historically, this stock follows specific seasonal patterns that institutional traders use to maximize returns.
- ✅ Identify the "Golden Buying Window"
- ✅ Avoid high-risk correction cycles
- ✅ Backtested data from the last 20+ years