
July 05, 2026 a 07:46 am


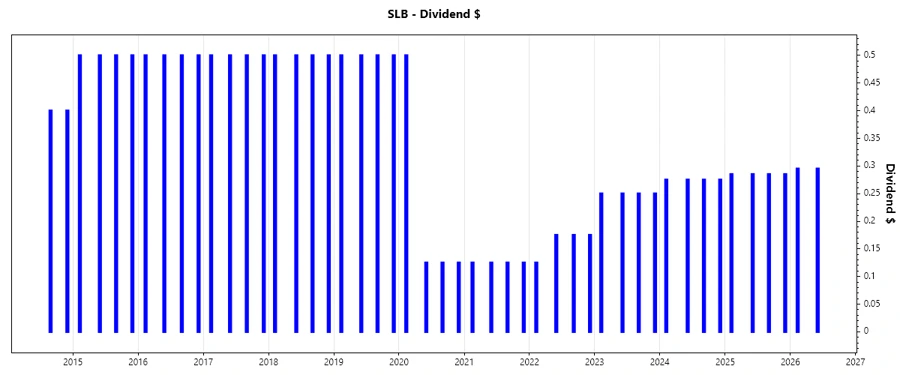

SLB: Dividend Analysis - Slb N.V.
Slb N.V. presents itself as a stable offering in the dividends arena, with a robust history of dividend payments spanning 45 years. This durability positions the company as a reliable pick for income-focused investors. However, a modest dividend yield might require potential investors to deeply evaluate growth prospects against existing market alternatives.
Overview 📊
Understanding the sector's positioning is vital, where SLB's dividend yield of 2.04% aligns with the market norm, ensuring competitive investor returns. The current dividend per share stands at 1.09 USD, sustained over 45 years, evidencing stable income history without recent cuts or suspensions.
| Sector | Dividend yield | Current dividend per share | Dividend history | Last cut or suspension |
|---|---|---|---|---|
| Oilfield Services | 2.04 % | 1.09 USD | 45 years | None |
Dividend History 🗣️
Analyzing dividend history offers insights into potential future income reliability. Maintaining consistent payouts cultivates investor confidence.
| Year | Dividend per share |
|---|---|
| 2026 | 0.590 USD |
| 2025 | 1.140 USD |
| 2024 | 1.100 USD |
| 2023 | 1.00 USD |
| 2022 | 0.650 USD |
Dividend Growth 📈
A metric of utmost interest, dividend growth reflects the company’s value appreciation ability. Over both 3 and 5-year timeframes, SLB's growth aligns moderately for long-term potential revenue compounding.
| Time | Growth |
|---|---|
| 3 years | 20.60 % |
| 5 years | 5.43 % |
The average dividend growth is 5.43 % over 5 years. This shows moderate but steady dividend growth.
Payout Ratio ✅
Payout ratios demonstrate distribution sustainability. With EPS-based at 49.39% and FCF-based at 34.81%, SLB maintains a balanced approach to distributing profits without compromising business expansion capabilities.
| Key figure | Ratio |
|---|---|
| EPS-based | 49.39 % |
| Free cash flow-based | 34.81 % |
The EPS-based and FCF-based ratios suggest SLB retains ample earnings, fortifying its balance sheet while rewarding shareholders.
Cashflow & Capital Efficiency 💰
Key indicators of SLB's cash-rich growth potential and investment efficiency. Monitoring these allows investors to gauge operational success in capital utilization and liquidity management.
| Year | Free Cash Flow Yield | Earnings Yield | CAPEX to Operating Cash Flow | Stock-based Compensation to Revenue | Free Cash Flow / Operating Cash Flow Ratio |
|---|---|---|---|---|---|
| 2025 | 8.49 % | 5.93 % | 26.10 % | 0.93 % | 73.89 % |
| 2024 | 8.21 % | 8.19 % | 32.25 % | 0.87 % | 67.75 % |
| 2023 | 6.13 % | 5.67 % | 31.52 % | 0.88 % | 68.48 % |
The metrics suggest a trend of high efficiency in capital expenditure utilization; operations remain cash flow positive.
Balance Sheet & Leverage Analysis ⚠️
Evaluating SLB's leverage ratios provides insight into the prudence of its debt strategy and overall financial fortitude, crucial for withstanding economic cycles.
| Year | Debt-to-Equity | Debt-to-Assets | Debt-to-Capital | Net Debt to EBITDA | Current Ratio | Quick Ratio |
|---|---|---|---|---|---|---|
| 2025 | 0.47 | 0.22 | 0.32 | 1.30 | 1.33 | 0.98 |
| 2024 | 0.57 | 0.25 | 0.36 | 1.06 | 1.45 | 1.11 |
| 2023 | 0.59 | 0.25 | 0.37 | 1.20 | 1.32 | 0.99 |
The company's moderate leverage and healthy liquidity ratios suggest a balanced approach, minimizing risk during downturns.
Fundamental Strength & Profitability 📉
Fundamental health is gauged through profitability metrics, reflecting the company’s efficiency and competitive edge in maximizing shareholder returns.
| Year | Return on Equity | Return on Assets | Net Margin | EBIT Margin | Gross Margin | R&D to Revenue |
|---|---|---|---|---|---|---|
| 2025 | 12.83 % | 6.11 % | 9.38 % | 14.66 % | 18.21 % | 1.99 % |
| 2024 | 21.11 % | 9.12 % | 12.29 % | 17.04 % | 20.56 % | 2.06 % |
| 2023 | 20.82 % | 8.76 % | 12.68 % | 17.46 % | 19.81 % | 2.15 % |
SLB's solid returns and consistent profitability margins underscore its strong industry position and operational expertise.
Price Development 💹
Dividend Scoring System ✅
| Criterion | Score (1-5) | Score Bar |
|---|---|---|
| Dividend yield | 3 | |
| Dividend stability | 4 | |
| Dividend growth | 3 | |
| Payout ratio | 4 | |
| Financial stability | 4 | |
| Dividend continuity | 4 | |
| Cashflow Coverage | 4 | |
| Balance Sheet Quality | 4 |
Total Score: 30/40
Rating ⭐⭐⭐⭐⭐
Considering its reliable dividend history and solid financials, Slb N.V. is a viable option for investors seeking steady income with acceptable growth potential. With its sturdy financial statements and reasonable payout ratios, it offers a prudent investment with reduced risk exposure.
Smart Data Insight
Master the Perfect Entry & Exit for this Stock
Don't leave your profits to chance. Historically, this stock follows specific seasonal patterns that institutional traders use to maximize returns.
- ✅ Identify the "Golden Buying Window"
- ✅ Avoid high-risk correction cycles
- ✅ Backtested data from the last 20+ years