August 19, 2025 a 07:32 am

SLB: Dividend Analysis - Schlumberger Limited
Schlumberger Limited maintains a robust dividend history with a yield of 3.41%, which is attractive for income-focused investors. The company has an impressive record of 44 years without a recent dividend cut or suspension. However, negative growth over 5 years raises concerns about sustainability. Despite these challenges, the relatively low payout ratios suggest that dividends are safely covered by earnings.
📊 Overview
An in-depth look at Schlumberger's dividend metrics reveals a stable but cautious environment for dividend sustainability.
| Metric | Value |
|---|---|
| Sector | Energy |
| Dividend Yield | 3.41% |
| Current Dividend per Share | $1.08 |
| Dividend History | 44 years |
| Last Cut or Suspension | None |
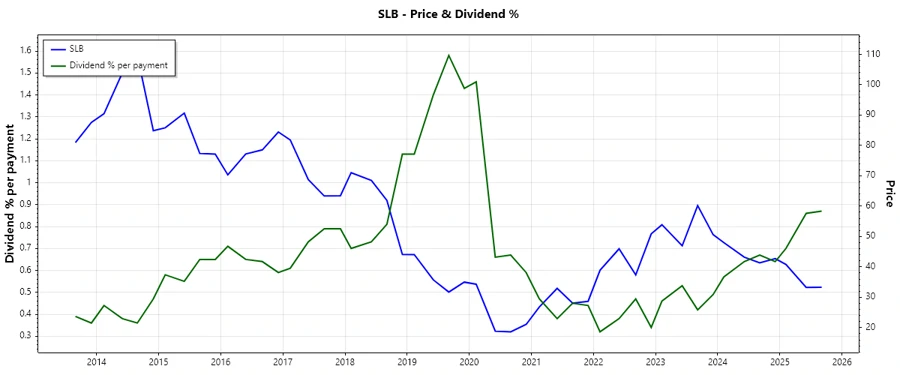
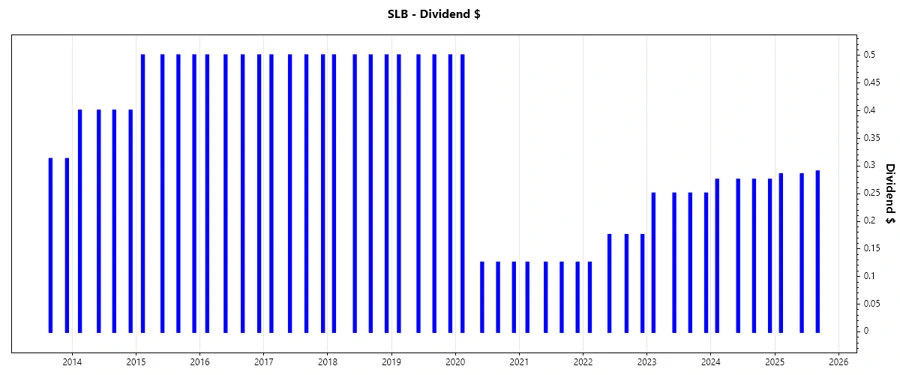
📈 Dividend History
The company has consistently paid dividends over the past 44 years. The lack of recent cuts is a testament to the company's commitment to returning value to shareholders.
| Year | Dividend per Share |
|---|---|
| 2025 | $0.86 |
| 2024 | $1.10 |
| 2023 | $1.00 |
| 2022 | $0.65 |
| 2021 | $0.50 |
📉 Dividend Growth
The dividend growth rate over 3 years is a marginal 0.30%, but the 5-year trend shows a negative growth of -11.27%, which calls for attention.
| Time | Growth |
|---|---|
| 3 years | 0.30% |
| 5 years | -11.27% |
The average dividend growth is -11.27% over 5 years. This shows a negative trend which may concern potential investors.
✅ Payout Ratio
The payout ratios are critical for assessing the company's ability to maintain its dividend. With an EPS-based payout ratio of 35.64% and a FCF-based ratio of 34.12%, Schlumberger's dividends are well-covered.
| Key Figure | Ratio |
|---|---|
| EPS-based | 35.64% |
| Free Cash Flow-based | 34.12% |
These metrics indicate that the company's dividends are sustainable under current earnings and cash flow conditions.
💰 Cashflow & Capital Efficiency
The management of cash flows and capital determines the company’s operational efficiency and potential for growth.
| Metric | 2024 | 2023 | 2022 |
|---|---|---|---|
| Free Cash Flow Yield | 8.21% | 6.13% | 2.65% |
| Earnings Yield | 8.19% | 5.67% | 4.55% |
| CAPEX to Operating Cash Flow | 32.25% | 31.52% | 46.10% |
| Stock-based Compensation to Revenue | 0.87% | 0.88% | 1.11% |
| Free Cash Flow / Operating Cash Flow Ratio | 67.75% | 68.48% | 53.90% |
These figures suggest that Schlumberger has managed its cash flows effectively, maintaining a positive cash flow trend and prudent capital efficiency.
📑 Balance Sheet & Leverage Analysis
Analyzing a company's balance sheet helps determine its leverage and liquidity metrics, essential for gauging financial health.
| Metric | 2024 | 2023 | 2022 |
|---|---|---|---|
| Debt-to-Equity | 0.57 | 0.59 | 0.69 |
| Debt-to-Assets | 0.25 | 0.25 | 0.28 |
| Debt-to-Capital | 0.36 | 0.37 | 0.41 |
| Net Debt to EBITDA | 1.06 | 1.20 | 1.64 |
| Current Ratio | - | 1.32 | 1.25 |
| Quick Ratio | 1.11 | 1.00 | 0.92 |
| Financial Leverage | 2.32 | 2.38 | 2.44 |
These indicators show an improvement in debt management and liquidity, as well as stable financial leverage.
🧩 Fundamental Strength & Profitability
Evaluating profitability metrics like margins and asset utilization gives insights into operational performance.
| Metric | 2024 | 2023 | 2022 |
|---|---|---|---|
| Return on Equity | 21.11% | 20.82% | 19.46% |
| Return on Assets | 9.12% | 8.76% | 7.98% |
| Margins | Net: 12.29% | Net: 12.68% | Net: 12.25% |
| EBIT Margin | 17.04% | 17.46% | 16.95% |
| EBITDA Margin | 22.24% | 22.77% | 22.89% |
| Gross Margin | 20.56% | 19.81% | 18.37% |
| Research & Development to Revenue | 2.06% | 2.15% | 2.26% |
The company shows healthy profitability and efficiency ratios, contributing to its long-term viability.
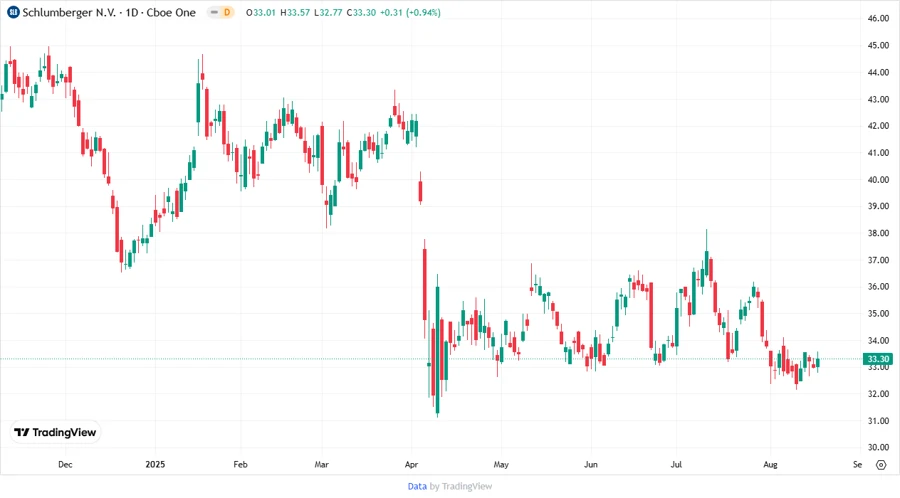
📉 Price Development
🏆 Dividend Scoring System
| Category | Score | Rating |
|---|---|---|
| Dividend Yield | 4 | |
| Dividend Stability | 5 | |
| Dividend Growth | 2 | |
| Payout Ratio | 5 | |
| Financial Stability | 4 | |
| Dividend Continuity | 5 | |
| Cashflow Coverage | 4 | |
| Balance Sheet Quality | 4 |
Total Score: 33/40 Points
🔍 Rating
Schlumberger Limited is a reliable dividend-paying stock with a substantial dividend yield. Its financial health supports the continuous payout, although the lack of recent growth is a concern. Overall, it scores 33 out of 40, making it a solid option for investors seeking stable dividend income.
Smart Data Insight
Master the Perfect Entry & Exit for this Stock
Don't leave your profits to chance. Historically, this stock follows specific seasonal patterns that institutional traders use to maximize returns.
- ✅ Identify the "Golden Buying Window"
- ✅ Avoid high-risk correction cycles
- ✅ Backtested data from the last 20+ years