August 11, 2025 a 12:47 pm


SLB: Dividend Analysis - Schlumberger Limited
Schlumberger Limited offers investors a solid dividend profile with a history of consistent distributions spanning 44 years. While the current dividend yield of 3.45% is intriguing, prospective investors must be wary of the recent downturn in dividend growth rates, with a notable drop in 5-year growth figures. The company’s low payout ratios suggest room for future dividend improvements, providing potential upside for long-term dividend growth investors.
📊 Overview
| Metric | Value |
|---|---|
| Sector | Energy |
| Dividend Yield | 3.45% |
| Current Dividend per Share | 1.08 USD |
| Dividend History | 44 years |
| Last Cut or Suspension | None |
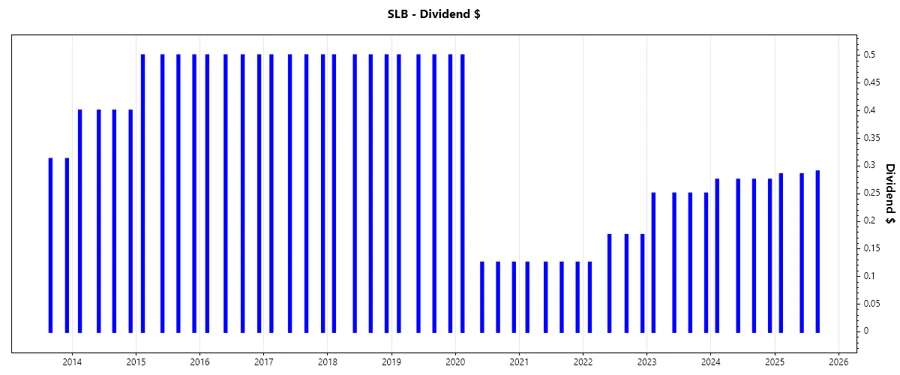
📈 Dividend History
Schlumberger has maintained a stable dividend policy over decades, indicating commitment to returning value to shareholders. The historical performance of dividends, captured over 44 years without cuts, reinforces confidence in its reliability. Detailed analysis of past payments is crucial for potential investors to gauge predictability.
| Year | Dividend per Share (USD) |
|---|---|
| 2025 | 0.86 |
| 2024 | 1.10 |
| 2023 | 1.00 |
| 2022 | 0.65 |
| 2021 | 0.50 |
📈 Dividend Growth
An essential component for evaluating a dividend-paying stock is its growth potential. With a disappointing 5-year dividend growth rate of -11.27%, investors need to be cautious. However, the 3-year growth rate is marginally positive. Such figures suggest the company is recalibrating its dividend policy to align with market conditions.
| Time | Growth |
|---|---|
| 3 years | 0.30% |
| 5 years | -11.27% |
The average dividend growth is -11.27% over 5 years. This shows a decline, indicating potential challenges or strategic reallocations by the company.
Payout Ratio
Understanding payout ratios help assess how much of the company's earnings are distributed as dividends. Schlumberger presents prudent payout ratios, reflecting sustainability.
| Key Figure | Ratio |
|---|---|
| EPS-based | 35.64% |
| Free cash flow-based | 34.12% |
With an EPS payout ratio of 35.64% and a FCF payout ratio of 34.12%, Schlumberger maintains a conservative stance, allowing reinvestment and future dividend growth potential.
Cashflow & Capital Efficiency
Evaluating cash flow and capital efficiency helps investors understand the company's financial health beyond the income statement.
| Year | Free Cash Flow Yield | Earnings Yield | CAPEX to Operating Cash Flow | Stock-based Compensation to Revenue | Free Cash Flow / Operating Cash Flow Ratio |
|---|---|---|---|---|---|
| 2024 | 8.21% | 8.19% | 32.25% | 0.87% | 67.75% |
| 2023 | 6.13% | 5.67% | 31.52% | 0.88% | 68.48% |
| 2022 | 2.65% | 4.55% | 46.10% | 1.11% | 53.90% |
Schlumberger's consistent free cash flow yield and restrained CAPEX point to efficient capital management, although previous years showed disproportionate cash flow allocation.
Balance Sheet & Leverage Analysis
Analyzing leverage and balance sheet strength determines the company's financial resilience under different economic conditions.
| Year | Debt-to-Equity | Debt-to-Assets | Debt-to-Capital | Net Debt to EBITDA | Current Ratio | Quick Ratio | Financial Leverage |
|---|---|---|---|---|---|---|---|
| 2024 | 0.57 | 0.25 | 0.36 | 1.06 | 1.45 | 1.11 | 2.32 |
| 2023 | 0.59 | 0.25 | 0.37 | 1.20 | 1.32 | 1.00 | 2.38 |
| 2022 | 0.69 | 0.28 | 0.41 | 1.64 | 1.25 | 0.92 | 2.44 |
These metrics highlight a solid balance sheet with manageable leverage, supporting Schlumberger's ability to meet financial obligations and invest in future growth.
Fundamental Strength & Profitability
Profitability ratios and fundamental metrics provide deep insight into the company's ability to generate returns.
| Year | ROE | ROA | ROIC | Net Margin | EBIT Margin | EBITDA Margin | Gross Margin | R&D to Revenue |
|---|---|---|---|---|---|---|---|---|
| 2024 | 21.11% | 9.12% | 13.74% | 12.29% | 17.04% | 22.24% | 20.56% | 2.06% |
| 2023 | 20.82% | 8.76% | 12.47% | 12.68% | 17.46% | 22.77% | 19.81% | 2.15% |
| 2022 | 19.46% | 7.98% | 10.36% | 12.25% | 16.95% | 22.89% | 18.37% | 2.26% |
Schlumberger showcases strong profitability with significant ROE and stable margins, reflecting effective management and robust operational efficiency.
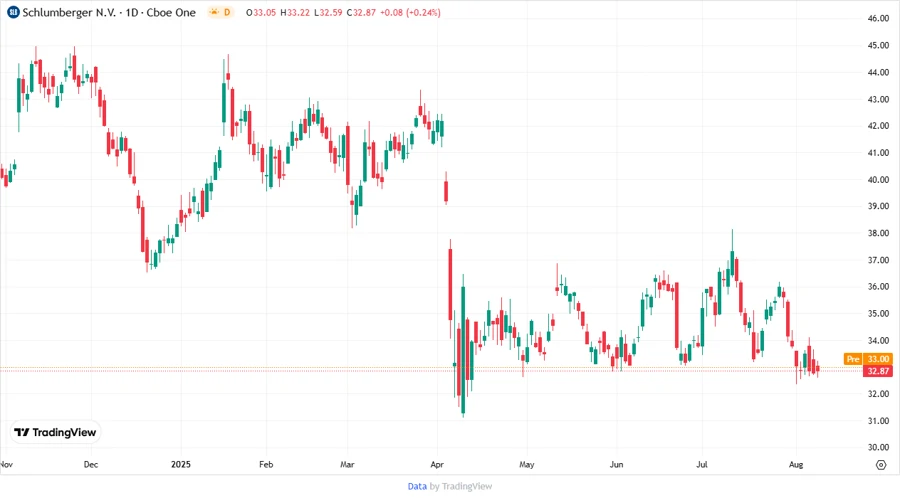
Price Development
🗣️ Dividend Scoring System
| Criteria | Score | Score Bar |
|---|---|---|
| Dividend Yield | 4 | |
| Dividend Stability | 5 | |
| Dividend Growth | 2 | |
| Payout Ratio | 5 | |
| Financial Stability | 4 | |
| Dividend Continuity | 5 | |
| Cashflow Coverage | 4 | |
| Balance Sheet Quality | 3 |
Total Score: 32/40
✅ Rating
Schlumberger Limited exhibits a robust dividend profile with solid dividend stability and payout ratios that afford room for future growth, despite recent negative growth trends. Its strong financials, supported by sustainable cash flows and manageable leverage, form a resilient investment proposition. This analysis suggests Schlumberger is a dependable choice for dividend-seeking investors with a moderate risk tolerance.
Smart Data Insight
Master the Perfect Entry & Exit for this Stock
Don't leave your profits to chance. Historically, this stock follows specific seasonal patterns that institutional traders use to maximize returns.
- ✅ Identify the "Golden Buying Window"
- ✅ Avoid high-risk correction cycles
- ✅ Backtested data from the last 20+ years