June 16, 2025 a 02:46 am


SLB: Dividend Analysis - Schlumberger Limited
Schlumberger Limited demonstrates a resilient dividend profile with a historical commitment over 44 years. Despite a recent decline in the dividend growth rate, the overall yield remains attractive. Strategic decisions around dividend stability will be crucial moving forward, especially amidst fluctuating market conditions.
📊 Overview
Schlumberger is a prominent player in the energy sector with a respectable dividend history.
| Parameter | Details |
|---|---|
| Sector | Energy |
| Dividend Yield | 3.37 % |
| Current Dividend Per Share | 1.08 USD |
| Dividend History | 44 years |
| Last Cut or Suspension | None |
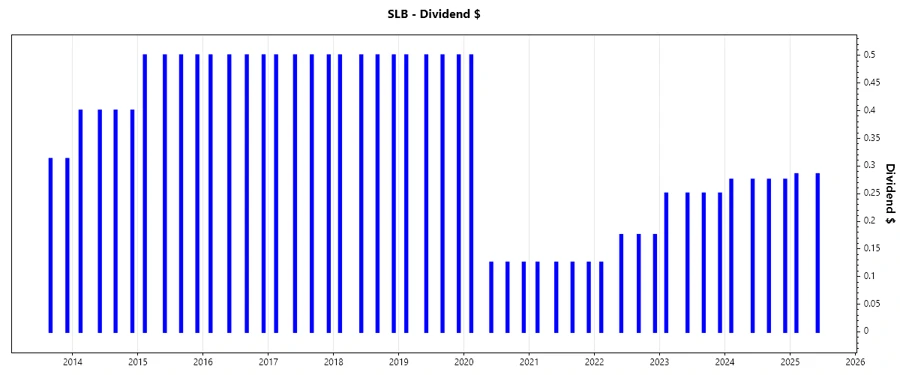
📈 Dividend History
The dividend history reflects the company's strong capacity to provide consistent returns over decades, indicating robustness and reliability in shareholder returns.
| Year | Dividend Per Share (USD) |
|---|---|
| 2025 | 0.57 |
| 2024 | 1.10 |
| 2023 | 1.00 |
| 2022 | 0.65 |
| 2021 | 0.50 |
✅ Dividend Growth
The examination of dividend growth reveals essential insights into SLB's potential for compounding returns over time.
| Time | Growth |
|---|---|
| 3 years | 0.30 % |
| 5 years | -0.11 % |
The average dividend growth is -0.11 % over 5 years, which indicates a slight decrease primarily impacted by recent economic conditions. Continued monitoring is recommended.
⚠️ Payout Ratio
Payout ratios offer critical insight into the sustainability of dividends by comparing them with earnings and cash flows.
| Key Figure | Ratio |
|---|---|
| EPS-based | 35.17 % |
| Free Cash Flow-based | 29.15 % |
The EPS payout ratio of 35.17 % indicates a prudent allocation of earnings to dividends, ensuring risk mitigation against earnings volatility.
💰 Cashflow & Capital Efficiency
Cashflow indicators and capital metrics assess how efficiently SLB uses its capital and generates cash flows relative to obligations.
| Metric | 2024 | 2023 | 2022 |
|---|---|---|---|
| Free Cash Flow Yield | 8.21% | 6.13% | 2.65% |
| Earnings Yield | 8.19% | 5.67% | 4.55% |
| CAPEX to Operating Cash Flow | 29.25% | 31.52% | 46.10% |
| Stock-based Compensation to Revenue | 0.87% | 0.88% | 1.11% |
| Free Cash Flow / Operating Cash Flow Ratio | 67.75% | 68.48% | 53.90% |
The cashflow ratios show strong cash retention capabilities and efficient capital utilization, indicating solid financial management.
📊 Balance Sheet & Leverage Analysis
Balance sheet metrics provide an understanding of SLB's financial health and its ability to meet liabilities.
| Metric | 2024 | 2023 | 2022 |
|---|---|---|---|
| Debt-to-Equity | 0.571 | 0.593 | 0.680 |
| Debt-to-Assets | 0.247 | 0.249 | 0.283 |
| Debt-to-Capital | 0.364 | 0.372 | 0.405 |
| Net Debt to EBITDA | 1.068 | 1.202 | 1.644 |
| Current Ratio | 1.450 | 1.323 | 1.248 |
| Quick Ratio | 1.108 | 0.995 | 0.916 |
| Financial Leverage | 2.316 | 2.375 | 2.398 |
The declining debt metrics indicate a strengthening financial position, essential for sustaining and growing dividends in the long term.
🗣️ Fundamental Strength & Profitability
Fundamental indicators reveal SLB's capability to generate profits relative to its equity and assets.
| Metric | 2024 | 2023 | 2022 |
|---|---|---|---|
| Return on Equity | 21.11% | 20.82% | 19.13% |
| Return on Assets | 9.12% | 8.76% | 7.98% |
| Net Margin | 12.29% | 12.68% | 12.25% |
| EBIT Margin | 17.04% | 17.46% | 16.95% |
| EBITDA Margin | 22.00% | 22.77% | 22.89% |
| Gross Margin | 20.56% | 19.81% | 18.37% |
| R&D to Revenue | 2.06% | 2.15% | 2.26% |
The robust profitability margins signify efficient cost management and enduring competitive advantage, favorably impacting their dividend-paying capacity.
📉 Price Development
🔍 Dividend Scoring System
| Criteria | Description | Score |
|---|---|---|
| Dividend Yield | Yield is above market average. | 4 |
| Dividend Stability | Historical consistency in dividends. | 5 |
| Dividend Growth | Flat to negative growth needs improvement. | 2 |
| Payout Ratio | Conservative, sustainable levels. | 4 |
| Financial Stability | Strong balance sheet metrics. | 4 |
| Dividend Continuity | Long period without cuts. | 5 |
| Cashflow Coverage | Solid coverage of dividend with cash flows. | 4 |
| Balance Sheet Quality | Strong historical figures. | 4 |
Total Score: 32/40
🔔 Rating
Schlumberger Limited maintains a commendable dividend profile with high stability and payout sustainability. While facing challenges in dividend growth, the overall potential remains promising. It is a robust choice for income-focused investors seeking stability with a trusted dividend history.
Smart Data Insight
Master the Perfect Entry & Exit for this Stock
Don't leave your profits to chance. Historically, this stock follows specific seasonal patterns that institutional traders use to maximize returns.
- ✅ Identify the "Golden Buying Window"
- ✅ Avoid high-risk correction cycles
- ✅ Backtested data from the last 20+ years