May 12, 2026 a 12:46 pm
SLB: Dividend Analysis - SLB N.V.
SLB N.V. demonstrates a robust dividend profile with a history of consistent payouts. Its moderate yield combined with steady growth makes it an attractive option for income-focused investors. The firm's adherence to a disciplined dividend policy for over four decades speaks to its commitment to shareholder returns. The current macroeconomic environment positions SLB well for future stability and potential growth in dividends.
📊 Overview
SLB N.V. operates within a resilient sector demonstrating a commitment to shareholder returns through stable dividends.
| Aspect | Details |
|---|---|
| Sector | Energy |
| Dividend yield | 2.11% |
| Current dividend per share | 1.09 USD |
| Dividend history | 45 years |
| Last cut or suspension | None |
🗣️ Dividend History
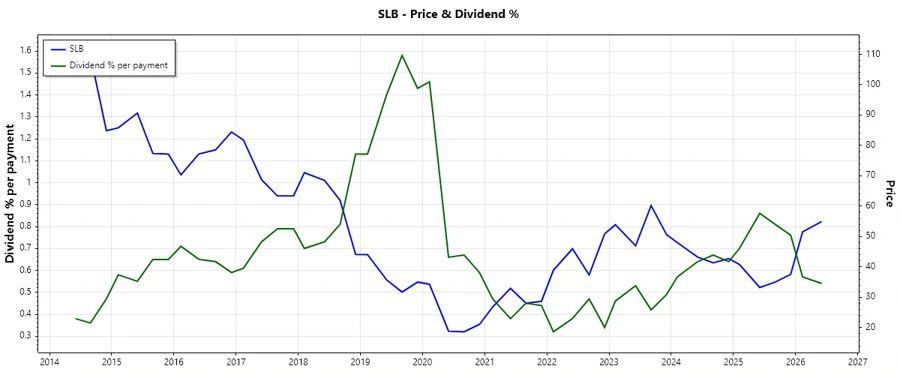
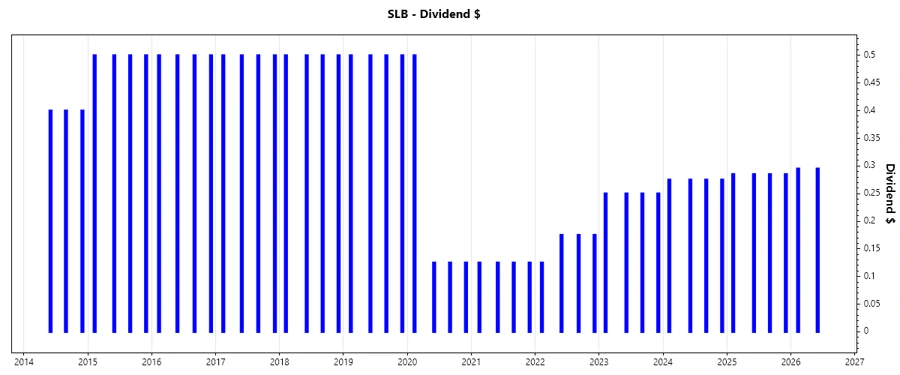
SLB’s long-standing dividend payment history reflects its financial health and commitment to returning capital to shareholders. Regular dividends have significance, showing investors the security of income and encouraging long-term investments. This track record can also help stabilize stock price volatility.
| Year | Dividend per Share (USD) |
|---|---|
| 2026 | 0.59 |
| 2025 | 1.14 |
| 2024 | 1.10 |
| 2023 | 1.00 |
| 2022 | 0.65 |
📈 Dividend Growth
Analysing SLB’s dividend growth provides insight into its earnings potential and future payout capacity, vital for assessing long-term investment value. Growth trends are crucial indicators for anticipating future company performance relative to peers.
| Time | Growth |
|---|---|
| 3 years | 20.60% |
| 5 years | 5.43% |
The average dividend growth is 5.43% over 5 years. This shows moderate but steady dividend growth, indicating potential for increased shareholder returns as earnings grow.
📉 Payout Ratio
Payout ratios highlight financial viability and return strategies. They signal how sustainable dividend payments are over the long term, aligning investor interests with corporate governance practices.
| Key figure ratio | Value |
|---|---|
| EPS-based | 49.39% |
| Free cash flow-based | 34.81% |
SLB's payout ratio of 49.39% (EPS) and 34.81% (FCF) reflects a balance between returning income to shareholders while retaining earnings for growth, indicating a healthy dividend policy.
💸 Cashflow & Capital Efficiency
SLB's cash flow metrics reflect operational efficiency and the ability for sustained dividend payments without compromising growth. Metrics like FCF yield measure liquidity and operational capabilities essential for ongoing management stability.
| Metric | 2025 | 2024 | 2023 |
|---|---|---|---|
| Free Cash Flow Yield | 8.49% | 8.21% | 6.13% |
| Earnings Yield | 5.93% | 8.19% | 5.67% |
| CAPEX to Operating Cash Flow | 26.11% | 32.25% | 31.52% |
| Stock-based Compensation to Revenue | 0.93% | 0.87% | 0.88% |
| Free Cash Flow / Operating Cash Flow Ratio | 73.89% | 67.75% | 68.48% |
By maintaining a stable Free Cash Flow against Operating Cash Flow, SLB ensures its capital requirements are met while delivering enhanced shareholder value. The company's strategic investments in CAPEX and efficient use of cash flows suggest sound resource allocation.
📊 Balance Sheet & Leverage Analysis
SLB's balance sheet metrics provide insights into its financial strength. Leverage ratios help determine capital structure and risk exposure, essential for evaluating potential debt servicing capabilities.
| Metric | 2025 | 2024 | 2023 |
|---|---|---|---|
| Debt-to-Equity | 0.47 | 0.57 | 0.59 |
| Debt-to-Assets | 0.22 | 0.24 | 0.25 |
| Debt-to-Capital | 0.32 | 0.36 | 0.37 |
| Net Debt to EBITDA | 1.30 | 1.06 | 1.20 |
| Current Ratio | 1.33 | 1.45 | 1.32 |
| Quick Ratio | 0.98 | 1.11 | 1.00 |
| Financial Leverage | 2.10 | 2.32 | 2.38 |
With prudent management of debt to equity and capital ratios, SLB leverages its financial stability to support corporate growth while maintaining liquidity envelopes capable of weathering financial exigencies.
✅ Fundamental Strength & Profitability
SLB’s profitability ratios are key indicators of financial robustness. Maintaining competitive margins and capital efficiency reveals operational competency and surplus value generation from invested capital.
| Metric | 2025 | 2024 | 2023 |
|---|---|---|---|
| Return on Equity | 12.83% | 21.11% | 20.82% |
| Return on Assets | 6.11% | 9.12% | 8.76% |
| Margins: Net | 9.38% | 12.29% | 12.68% |
| Margins: EBIT | 14.66% | 17.04% | 17.46% |
| Margins: EBITDA | 20.01% | 22.24% | 22.77% |
| Margins: Gross | 18.21% | 20.56% | 19.81% |
| Research & Development to Revenue | 1.98% | 2.06% | 2.15% |
Robust returns across equity and assets underscore SLB’s effective strategy in managing resources for maximal profitability. High margins reflect successful cost management and ambitious R&D investments.
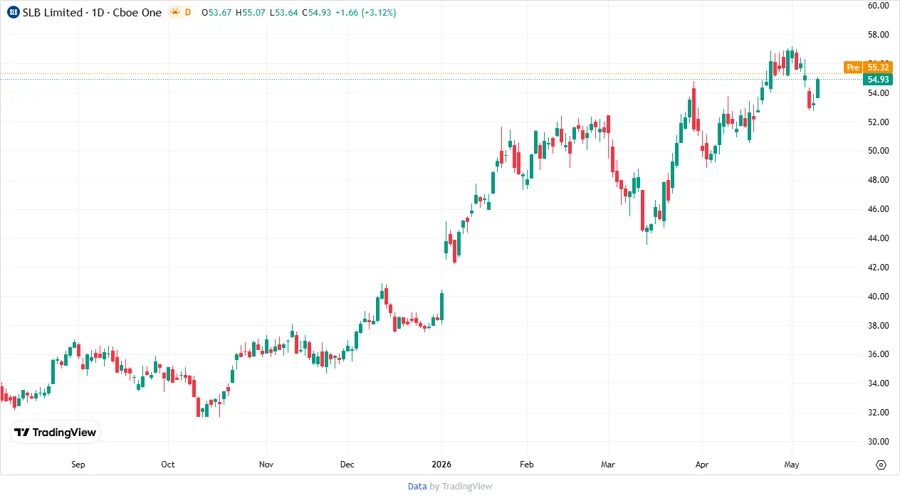
📈 Price Development
Dividend Scoring System
| Category | Rating (out of 5) | Score Bar |
|---|---|---|
| Dividend yield | 4 | |
| Dividend Stability | 5 | |
| Dividend growth | 3 | |
| Payout ratio | 4 | |
| Financial stability | 4 | |
| Dividend continuity | 5 | |
| Cashflow Coverage | 4 | |
| Balance Sheet Quality | 4 |
Total Score: 33/40
🎯 Rating
SLB N.V. offers a compelling investment opportunity for dividend-focused investors. Its consistent payout history, strong financial metrics, and manageable payout ratios indicate that dividends are both sustainable and potentially poised for growth. Given current market conditions, SLB represents a balanced risk and reward profile, making it an appealing choice for those emphasizing reliable income generation.
Smart Data Insight
Master the Perfect Entry & Exit for this Stock
Don't leave your profits to chance. Historically, this stock follows specific seasonal patterns that institutional traders use to maximize returns.
- ✅ Identify the "Golden Buying Window"
- ✅ Avoid high-risk correction cycles
- ✅ Backtested data from the last 20+ years