April 28, 2026 a 11:31 am
SLB: Dividend Analysis - SLB N.V.
SLB N.V. exhibits a commendable performance in its dividend distribution with a stable record of 45 consecutive years of dividend history. It maintains a respectable dividend yield of 2.11%, offering a reliable income stream for investors. With a reasonable payout ratio and a steady dividend growth trajectory over recent years, SLB N.V. is positioned as a promising candidate for dividend-focused portfolios.
📊 Overview
SLB N.V. operates in a dynamic sector where stability and reliability are key. It delivers a modest dividend yield of 2.11%, with a current dividend per share set at $1.09. The company has demonstrated resilience with 45 years of dividend history and has not experienced a dividend cut or suspension in recent times.
| Parameter | Value |
|---|---|
| Sector | |
| Dividend yield | 2.11% |
| Current dividend per share | 1.09 USD |
| Dividend history | 45 years |
| Last cut or suspension | None |
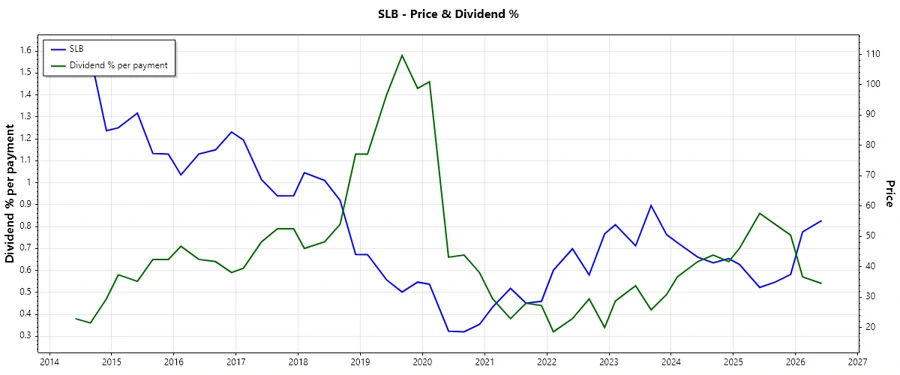
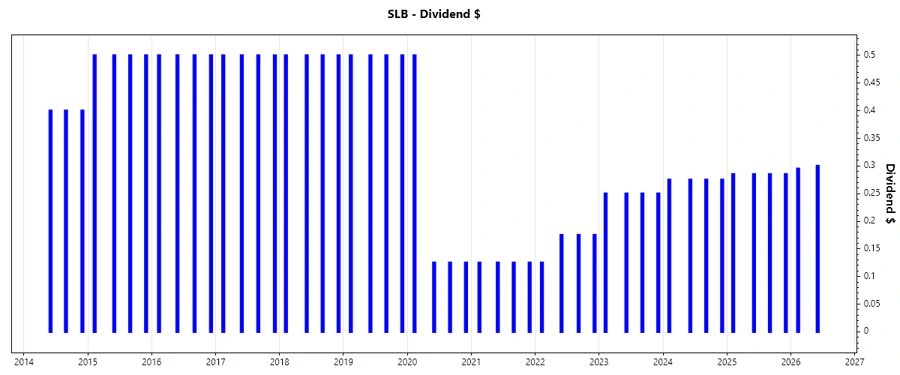
🗣️ Dividend History
The company's robust dividend history underscores its commitment to returning value to shareholders. Such consistency is especially significant in uncertain market conditions, providing assurance to investors about the financial health and stability of SLB N.V.
| Year | Dividend per Share (USD) |
|---|---|
| 2026 | 0.595 |
| 2025 | 1.140 |
| 2024 | 1.100 |
| 2023 | 1.00 |
| 2022 | 0.650 |
📈 Dividend Growth
The dividend growth rates of SLB N.V. are indicative of moderate, yet consistent, improvements in shareholder returns. The 5-year average growth rate stands at 5.43%, marking the company's dedication to increasing shareholder values over time.
| Time | Growth |
|---|---|
| 3 years | 20.60% |
| 5 years | 5.43% |
The average dividend growth is 5.43% over 5 years. This shows moderate but steady dividend growth.
📉 Payout Ratio
SLB N.V. maintains a healthy payout ratio, which is a critical factor to assess its ability to sustain and potentially increase dividends. With a current EPS-based payout ratio of 49.39% and a FCF-based ratio of 34.09%, the company demonstrates financial prudence and a strategic approach to dividend distribution.
| Key figure | Ratio |
|---|---|
| EPS-based | 49.39% |
| Free cash flow-based | 34.09% |
These payout levels suggest that SLB N.V. is managing to balance returning cash to shareholders with retaining enough capital for further investment opportunities, ensuring continued growth and financial strength.
✅ Cashflow & Capital Efficiency
Assessing the cash flow and capital efficiency of SLB N.V. is crucial to understand its operational health and investment return potential. The metrics show a robust free cash flow yield coupled with efficient capital allocations.
| Year | 2025 | 2024 | 2023 |
|---|---|---|---|
| Free Cash Flow Yield | 8.49% | 8.21% | 6.13% |
| Earnings Yield | 5.93% | 8.19% | 5.67% |
| CAPEX/Operating Cash Flow | 26.11% | 32.25% | 31.52% |
| Stock-based Comp./Revenue | 0.93% | 0.87% | 0.88% |
| Free Cash Flow/Operating Cash Flow | 73.89% | 67.75% | 68.48% |
SLB N.V. demonstrates strong cash flow stability and effective capital management. This strategic efficiency underpins the company's ability to sustain dividends and reinvest in growth initiatives.
⚠️ Balance Sheet & Leverage Analysis
Reviewing the balance sheet and leverage provides insights into SLB N.V.'s financial resilience and liquidity posture. Key leverage ratios indicate a balanced approach to debt management.
| Year | 2025 | 2024 | 2023 |
|---|---|---|---|
| Debt-to-Equity | 0.47 | 0.57 | 0.59 |
| Debt-to-Assets | 0.22 | 0.25 | 0.25 |
| Debt-to-Capital | 0.32 | 0.36 | 0.37 |
| Net Debt to EBITDA | 1.30 | 1.06 | 1.20 |
| Current Ratio | 1.33 | 1.45 | 1.32 |
| Quick Ratio | 0.98 | 1.11 | 0.99 |
| Financial Leverage | 2.10 | 2.32 | 2.38 |
SLB N.V. maintains a strong financial position with manageable levels of leverage and a solid liquidity profile, enhancing its capacity to meet short-term obligations and invest in long-term growth.
Fundamental Strength & Profitability
Analyzing SLB N.V.'s fundamental strengths and profitability offers a window into its operational efficiency and profit-generating capabilities.
| Year | 2025 | 2024 | 2023 |
|---|---|---|---|
| Return on Equity | 12.83% | 21.11% | 20.82% |
| Return on Assets | 6.11% | 9.12% | 8.76% |
| Net Margin | 9.38% | 12.29% | 12.68% |
| EBIT Margin | 14.66% | 17.04% | 17.46% |
| EBITDA Margin | 20.01% | 22.23% | 22.77% |
| Gross Margin | 18.21% | 20.56% | 19.81% |
| R&D to Revenue | 1.99% | 2.06% | 2.15% |
The profitability metrics reveal that SLB N.V. is efficient in its operations, translating revenue into net profits effectively, while maintaining competitive return metrics.
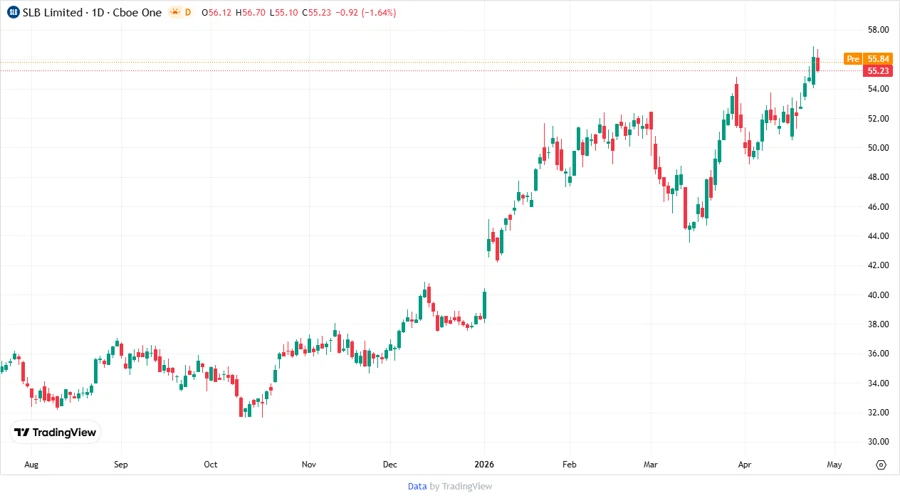
Price Development
Dividend Scoring System
| Criteria | Score | Score Bar |
|---|---|---|
| Dividend yield | 3 | |
| Dividend Stability | 5 | |
| Dividend growth | 4 | |
| Payout ratio | 4 | |
| Financial stability | 4 | |
| Dividend continuity | 5 | |
| Cashflow Coverage | 4 | |
| Balance Sheet Quality | 4 |
Total Score: 33/40
🔍 Rating
Based on comprehensive evaluation, SLB N.V. is a solid choice for dividend investors seeking stable income with moderate growth prospects. Its robust financial metrics, strong dividend track record, and prudent management practices make it a reliable component of a diversified investment portfolio.