
April 19, 2026 a 12:46 pm
SLB: Dividend Analysis - SLB N.V.
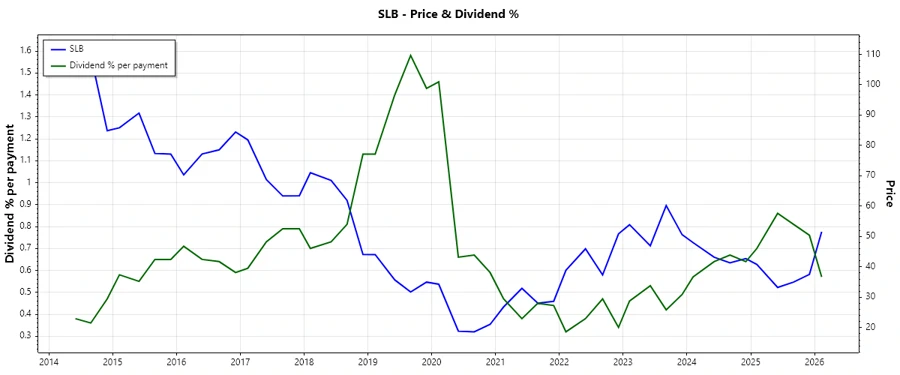
SLB N.V., boasting a market cap of $79.05 billion, stands out in the energy sector for its steadfast dividend policy. With an impressive 45-year dividend history, it managed to uphold a dividend yield of 2.23%, showcasing resilience and commitment to shareholder returns. The company's dedication to sustaining dividend payouts even during challenging periods underscores its strength. 📊
Overview
SLB's standing in the energy sector reflects its robust business model with consistent dividend policies, underscoring stability. Here's a quick overview:
| Metric | Value |
|---|---|
| Sector | Energy |
| Dividend yield | 2.23% |
| Current dividend per share | 1.09 USD |
| Dividend history | 45 years |
| Last cut or suspension | None |
Dividend History
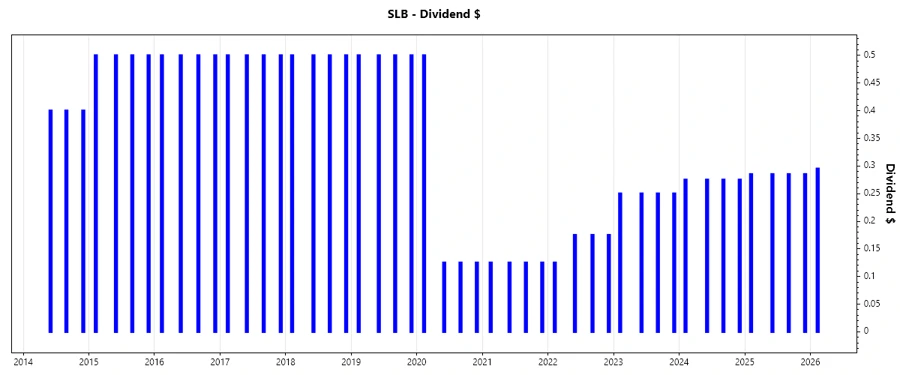
SLB's rich dividend history over 45 years highlights its reliability as an investment. Investors frequently seek companies that maintain consistent dividend payments, indicative of strong financial health and stable cash flows.
| Year | Dividend per Share (USD) |
|---|---|
| 2026 | 0.295 |
| 2025 | 1.14 |
| 2024 | 1.10 |
| 2023 | 1.00 |
| 2022 | 0.65 |
Dividend Growth
Growth rates signal a company's potential to increase dividends over time, reflecting operational success. SLB's dividend growth indicates moderate but stable enhancement.
| Time | Growth |
|---|---|
| 3 years | 20.60% |
| 5 years | 5.43% |
The average dividend growth is 5.43% over 5 years. This shows moderate but steady dividend growth. 📈
Payout Ratio
The payout ratios help evaluate how sustainable and safe the dividend payments are. SLB enjoys balanced payout ratios, suggesting financial responsibility and room for reinvestment.
| Key figure | Ratio |
|---|---|
| EPS-based | 47.82% |
| Free cash flow-based | 34.09% |
Both EPS and FCF payout ratios are within safe ranges, indicating well-covered dividends with financial leeway. ✅
Cashflow & Capital Efficiency
Strong cash flows and optimal capital efficiency directly affect a company's ability to maintain and grow dividends. Let's examine SLB's metrics:
| Metric | 2025 | 2024 | 2023 |
|---|---|---|---|
| Free Cash Flow Yield | 8.49% | 8.21% | 6.13% |
| Earnings Yield | 5.93% | 8.19% | 5.67% |
| CAPEX to Operating Cash Flow | 26.11% | 32.25% | 31.52% |
| Stock-based Compensation to Revenue | 0.93% | 0.87% | 0.88% |
| Free Cash Flow / Operating Cash Flow Ratio | 73.89% | 67.75% | 68.48% |
SLB's strong cash flow yield and balanced CAPEX indicate efficient capital utilization that supports dividend sustainability. The company maintains a reasonable balance of reinvestment and shareholder returns. ⚖️
Balance Sheet & Leverage Analysis
Analyzing leverage gives insights into the company's ability to service its debt, a crucial factor for dividend consistency.
| Metric | 2025 | 2024 | 2023 |
|---|---|---|---|
| Debt-to-Equity | 0.471 | 0.571 | 0.593 |
| Debt-to-Assets | 0.224 | 0.247 | 0.249 |
| Debt-to-Capital | 0.320 | 0.364 | 0.372 |
| Net Debt to EBITDA | 1.297 | 1.057 | 1.202 |
| Current Ratio | 1.326 | 1.323 | |
| Quick Ratio | 0.984 | 1.108 | 0.995 |
| Financial Leverage | 2.101 | 2.316 | 2.375 |
SLB's balance sheet shows manageable leverage, indicating sound financial health, essential for continued dividend reliability. 🛡️
Fundamental Strength & Profitability
A company's profitability is an indicator of its efficiency and potential to generate returns for shareholders. Key metrics are shown below:
| Metric | 2025 | 2024 | 2023 |
|---|---|---|---|
| Return on Equity | 12.83% | 21.11% | 20.82% |
| Return on Assets | 6.11% | 9.12% | 8.76% |
| Margins: Net | 9.38% | 12.29% | 12.68% |
| Margins: EBIT | 14.66% | 17.04% | 17.46% |
| Margins: EBITDA | 20.01% | 22.24% | 22.77% |
| Margins: Gross | 18.21% | 20.56% | 19.81% |
| R&D to Revenue | 1.99% | 2.06% | 2.15% |
SLB's strong profitability and return metrics indicate efficient use of resources and robust potential for sustaining dividends. 📈
Price Development
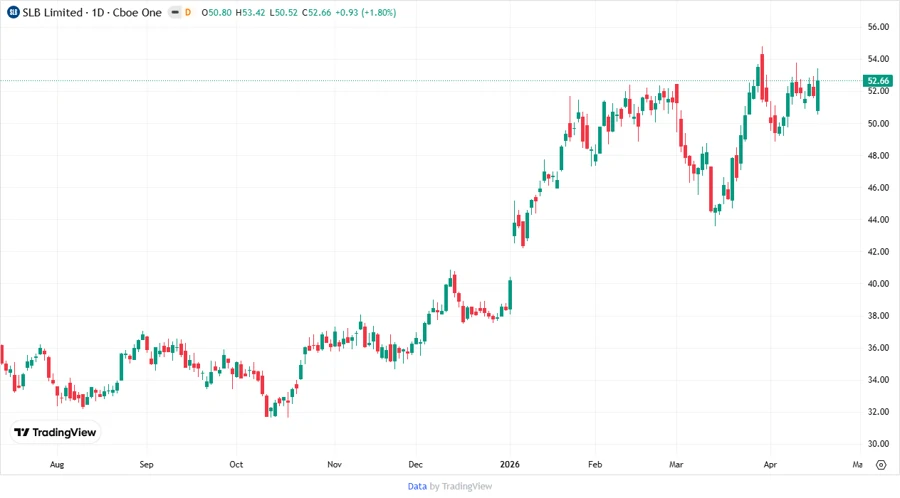
Monitoring price movements helps investors gain insights into shareholder sentiment and market trends.
Dividend Scoring System
| Criterion | Score | |
|---|---|---|
| Dividend yield | 3 | |
| Dividend Stability | 5 | |
| Dividend growth | 4 | |
| Payout ratio | 4 | |
| Financial stability | 4 | |
| Dividend continuity | 5 | |
| Cashflow Coverage | 4 | |
| Balance Sheet Quality | 3 |
Total Score: 32/40
Rating
SLB N.V. emerges as a resilient dividend player with strong financials, stable payout history, and prudent cash flow management. This positions SLB as a solid choice for investors seeking reliable, moderate income growth. We rate SLB a "BUY" for income-oriented portfolios. 🗣️
Smart Data Insight
Master the Perfect Entry & Exit for this Stock
Don't leave your profits to chance. Historically, this stock follows specific seasonal patterns that institutional traders use to maximize returns.
- ✅ Identify the "Golden Buying Window"
- ✅ Avoid high-risk correction cycles
- ✅ Backtested data from the last 20+ years