February 13, 2026 a 07:31 am
SLB: Dividend Analysis - SLB N.V.
SLB N.V., with a robust dividend history spanning 45 years, represents a steady investment in the energy sector. With a current dividend yield of 2.23%, the company displays a stable dividend profile. However, dividend growth has been moderate over the past five years, which is a factor to consider for growth-oriented investors. The company's payout ratios reflect a balanced approach to dividend payments, ensuring sustainability without compromising reinvestment in the business.
📊 Overview
In the energy sector, SLB N.V. offers investors both stability and modest growth potential. With a consistent dividend history and a lack of recent cuts or suspensions, it remains a reliable choice for income-focused investors.
| Metric | Value |
|---|---|
| Sector | Energy |
| Dividend Yield | 2.23% |
| Current Dividend Per Share | 1.09 USD |
| Dividend History | 45 years |
| Last Cut or Suspension | None |
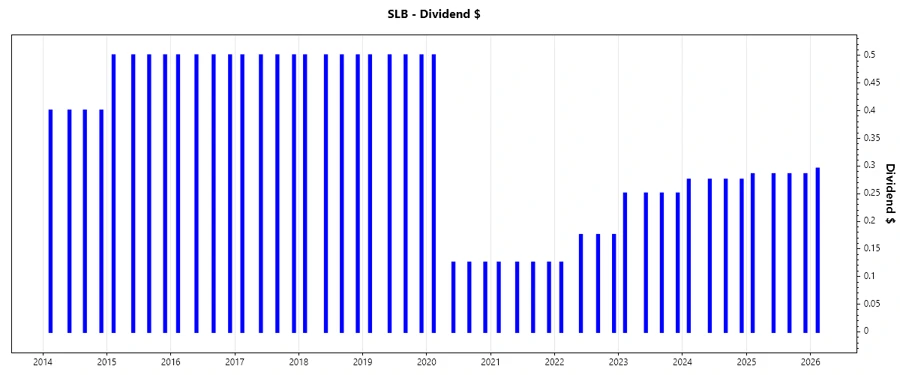
🗣️ Dividend History
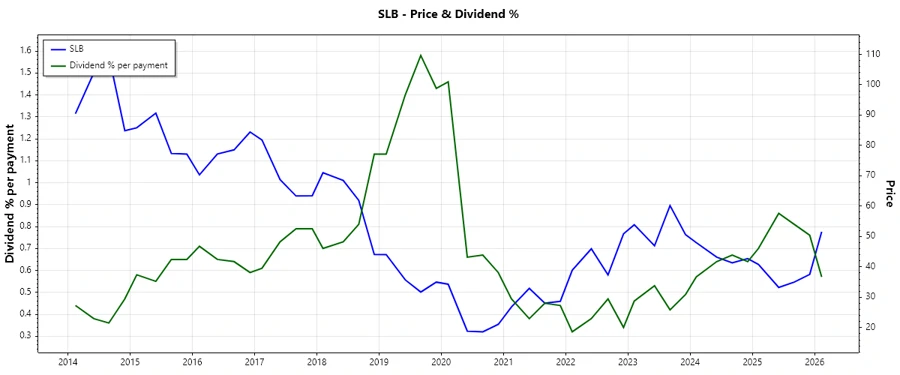
SLB N.V.'s dividend history highlights its commitment to returning value to shareholders despite market fluctuations. This aspect of a company's financial behavior often correlates with management's confidence in future cash flows and overall business health.
| Year | Dividend Per Share (USD) |
|---|---|
| 2026 | 0.295 |
| 2025 | 1.140 |
| 2024 | 1.100 |
| 2023 | 1.00 |
| 2022 | 0.650 |
📈 Dividend Growth
Assessing SLB N.V. based on its five-year dividend growth reveals a gradual increase, signaling stable but modest enhancement. For income investors, this indicates a reassuring, albeit slow, trend in dividend escalation.
| Time | Growth |
|---|---|
| 3 years | 20.59% |
| 5 years | 5.43% |
The average dividend growth is 5.43% over 5 years. This shows moderate but steady dividend growth.
✅ Payout Ratio
The payout ratio is a crucial indicator of dividend sustainability. SLB's payout ratios show a well-managed strategy, balancing shareholder returns with business reinvestment.
| Key Figure | Ratio |
|---|---|
| EPS-based | 47.82% |
| Free cash flow-based | 33.96% |
With an EPS payout ratio of 47.82% and a FCF payout ratio of 33.96%, SLB N.V. maintains a disciplined approach to dividend distributions, allowing for potential growth opportunities and financial resilience.
⚠️ Cashflow & Capital Efficiency
Analyzing cash flow stability and capital efficiency is vital to understanding SLB N.V.'s long-term financial health. Key metrics include the company's ability to generate free cash flow relative to its operational demands.
| Metric | 2025 | 2024 | 2023 |
|---|---|---|---|
| Free Cash Flow Yield | 8.49% | 8.21% | 6.13% |
| Earnings Yield | 5.93% | 8.18% | 5.67% |
| CAPEX to Operating Cash Flow | 26.11% | 32.25% | 31.52% |
| Stock-based Compensation to Revenue | 0.93% | 0.87% | 0.88% |
| Free Cash Flow / Operating Cash Flow Ratio | 73.89% | 67.75% | 68.48% |
SLB's consistent free cash flow yield and efficient capital management underline its capacity to cover dividends and reinvest in growth, fostering shareholder confidence.
📉 Balance Sheet & Leverage Analysis
Evaluating SLB's balance sheet and leverage ratios offers insights into its financial strength and risk exposure. Maintaining an optimal level of debt relative to equity and assets is crucial for sustainability.
| Metric | 2025 | 2024 | 2023 |
|---|---|---|---|
| Debt-to-Equity | 0.47 | 0.57 | 0.59 |
| Debt-to-Assets | 0.22 | 0.25 | 0.25 |
| Debt-to-Capital | 0.32 | 0.36 | 0.37 |
| Net Debt to EBITDA | 1.30 | 1.06 | 1.20 |
| Current Ratio | 1.33 | 1.45 | 1.32 |
| Quick Ratio | 0.98 | 1.11 | 1.00 |
| Financial Leverage | 2.10 | 2.32 | 2.38 |
SLB manages its leverage prudently, with debt ratios indicating a controlled risk profile, supporting its long-term financial flexibility and stability.
📊 Fundamental Strength & Profitability
An understanding of SLB's fundamental strength and profitability provides insights into its operational efficiency and competitive positioning. Measuring returns and margins is key to assessing viability and growth capacity.
| Metric | 2025 | 2024 | 2023 |
|---|---|---|---|
| Return on Equity | 12.83% | 21.11% | 20.82% |
| Return on Assets | 6.11% | 9.12% | 8.76% |
| Margins: Net | 9.38% | 12.29% | 12.68% |
| EBIT | 14.66% | 17.04% | 17.46% |
| EBITDA | 20.01% | 22.24% | 22.77% |
| Gross | 18.21% | 20.56% | 19.81% |
| Research & Development to Revenue | 1.99% | 2.06% | 2.15% |
SLB's solid profitability margins and consistent returns signal robust business management and strategic industry positioning, ensuring competitive advantage.
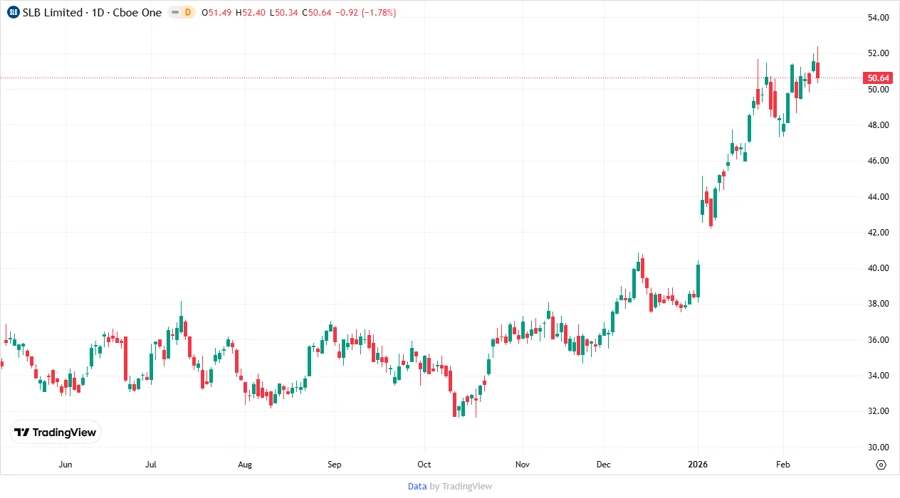
🔍 Price Development
📊 Dividend Scoring System
This scoring system evaluates SLB's dividend performance across several key criteria, assigning a score that synthesizes overall dividend quality.
| Criteria | Score | Score Bar |
|---|---|---|
| Dividend Yield | 3 | |
| Dividend Stability | 5 | |
| Dividend Growth | 2 | |
| Payout Ratio | 4 | |
| Financial Stability | 4 | |
| Dividend Continuity | 5 | |
| Cashflow Coverage | 4 | |
| Balance Sheet Quality | 4 |
Total Score: 31/40
🗣️ Rating
SLB N.V. presents a solid investment case characterized by reliable dividends, commendable financial operations, and sustained growth potential. While dividend growth has been modest, the company's ability to maintain a consistent payout despite market challenges is to be commended. Investors seeking stable returns with lower risk may find SLB a worthy addition to their portfolio. Overall, SLB receives a favorable dividend rating with positive growth prospects.