January 29, 2026 a 11:31 am

SLB: Dividend Analysis - SLB N.V.
SLB N.V. presents a solid dividend profile with a notable 45-year history of continuous dividend payments, reflecting the company's commitment to returning value to shareholders. With a current dividend yield of 2.35%, investors can enjoy a steady income stream. The absence of any recent cut or suspension strengthens the confidence in SLB’s dividend reliability. However, moderate dividend growth indicates that substantial capital gains should not be expected in the near term.
📊 Overview
The overview provides key dividend metrics essential for understanding SLB N.V.'s yield offerings and historical reliability.
| Factor | Details |
|---|---|
| Sector | |
| Dividend yield | 2.35% |
| Current dividend per share | 1.13 USD |
| Dividend history | 45 years |
| Last cut or suspension | None |
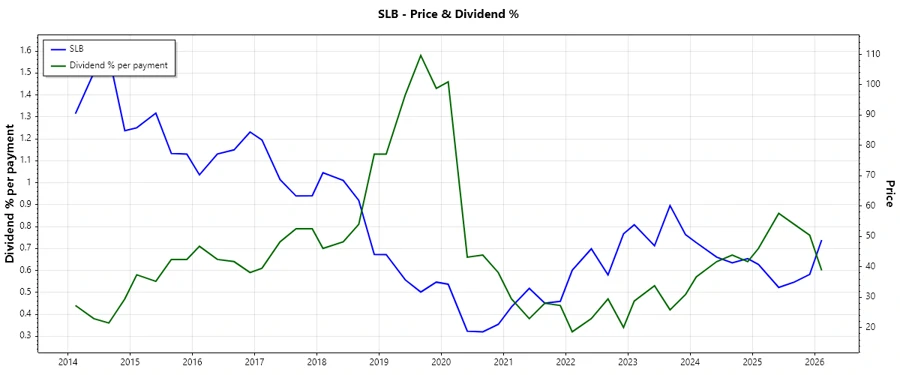
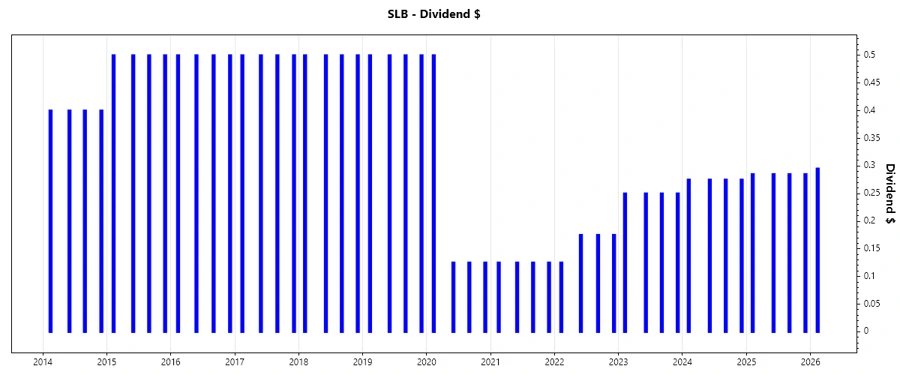
📈 Dividend History
SLB N.V.'s dividend history demonstrates the company’s consistent approach to shareholder returns. A lengthy 45-year history without a recent cut or suspension signifies robust financial health and strategic foresight.
| Year | Dividend per Share (USD) |
|---|---|
| 2026 | 0.295 |
| 2025 | 1.14 |
| 2024 | 1.10 |
| 2023 | 1.00 |
| 2022 | 0.65 |
📈 Dividend Growth
Monitoring dividend growth is crucial to gauge the potential for increasing income over time and SLB’s long-term financial strategy.
| Time | Growth |
|---|---|
| 3 years | 20.60% |
| 5 years | 5.43% |
The average dividend growth is 5.43% over 5 years. This shows moderate but steady dividend growth.
📉 Payout Ratio
Payout ratios help assess the sustainability of dividends, highlighting the company's capacity to maintain payouts relative to earnings and cash flow.
| Key figure ratio | Value |
|---|---|
| EPS-based | 49.50% |
| Free cash flow-based | 41.83% |
SLB's EPS payout ratio of 49.50% and FCF payout ratio of 41.83% indicate reasonably balanced dividend commitments, suggesting sustainability while allowing for future growth initiatives.
✅ Cashflow & Capital Efficiency
Analysis of key cashflow and capital efficiency metrics provides insights into SLB's operational performance and investment efficiency.
| Metric | 2023 | 2024 | 2025 |
|---|---|---|---|
| Free Cash Flow Yield | 6.13% | 8.21% | 8.79% |
| Earnings Yield | 5.67% | 8.19% | 6.19% |
| CAPEX to Operating Cash Flow | 31.52% | 32.25% | 26.11% |
| Stock-based Compensation to Revenue | 0.88% | 0.87% | 0.93% |
| Free Cash Flow / Operating Cash Flow Ratio | 68.48% | 67.75% | 73.89% |
The stable cash flow yields and improving ratios reflect SLB's capacity to efficiently convert operational performance into financial returns, leveraging significant capital expenditure accordingly.
📊 Balance Sheet & Leverage Analysis
Understanding SLB's leverage and financial structure is vital to assessing risk and financial health.
| Metric | 2023 | 2024 | 2025 |
|---|---|---|---|
| Debt-to-Equity Ratio | 59.26% | 57.14% | 31.57% |
| Debt-to-Assets Ratio | 24.95% | 24.67% | 23.56% |
| Debt-to-Capital Ratio | 37.21% | 36.36% | 23.99% |
| Net Debt to EBITDA | 1.20 | 1.06 | 1.36 |
| Current Ratio | 1.32 | 1.45 | 6.43 |
| Quick Ratio | 1.00 | 1.11 | 4.63 |
| Financial Leverage | 2.38 | 2.32 | 1.34 |
SLB N.V.'s lowering debt metrics combined with improving liquidity ratios point to a solidifying competitive financial base, indicating strong capacity for ongoing obligations fulfillment and risk mitigation.
🗣️ Fundamental Strength & Profitability
Evaluating SLB's profitability ratios provides insight into its operational efficiency and capacity for sustaining dividends.
| Metric | 2023 | 2024 | 2025 |
|---|---|---|---|
| Return on Equity | 20.82% | 21.11% | 9.15% |
| Return on Assets | 8.76% | 9.12% | 6.83% |
| Return on Invested Capital | 12.47% | 13.74% | 8.85% |
| Margins: Net | 12.68% | 12.29% | 9.45% |
| Margins: EBIT | 17.46% | 17.04% | 0% |
| Margins: EBITDA | 22.77% | 22.24% | 15.29% |
| Margins: Gross | 19.81% | 20.56% | 18.22% |
| Research & Development to Revenue | 2.15% | 2.06% | 1.99% |
SLB's high return on equity and net profit margins underscore robust profitability, fortifying its potential for sustaining and even increasing dividend payouts in the future.
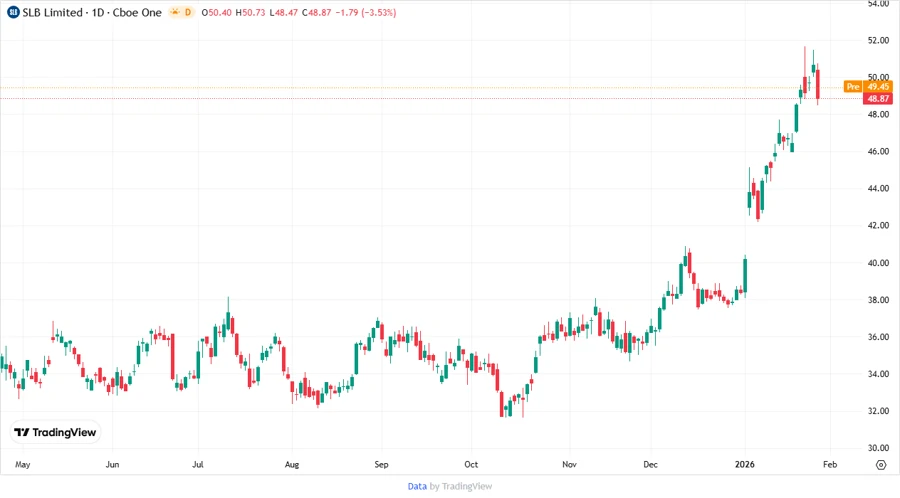
📈 Price Development
✅ Dividend Scoring System
The following scoring system provides a comprehensive evaluation of SLB N.V.'s dividend quality and sustainability based on key criteria:
| Criterion | Score | Score Bar |
|---|---|---|
| Dividend yield | 4 | |
| Dividend Stability | 5 | |
| Dividend growth | 3 | |
| Payout ratio | 4 | |
| Financial stability | 5 | |
| Dividend continuity | 5 | |
| Cashflow Coverage | 4 | |
| Balance Sheet Quality | 5 |
Total Score: 35/40
📈 Rating
SLB N.V. earns a robust dividend profile rating, attributed to its stable financial foundation, consistent dividend history, and prudent payout ratios. It offers a strong and reliable income potential for shareholders, seeking both stability and gradual growth, making it an attractive addition for yield-focused investors.