January 28, 2026 a 07:47 am


SLB: Dividend Analysis - SLB N.V.
SLB N.V. demonstrates a strong and consistent dividend policy, paramount for income-focused investors. Its 45-year dividend history reflects a sustained commitment to returning value to shareholders, despite macroeconomic challenges. With a reasonable dividend yield just over 2%, and steady growth observed over recent years, SLB's performance is indicative of its robust financial standing. An analysis of its payout ratios suggests prudent fiscal management, further substantiated by solid cash flow metrics and capital efficiency. Overall, SLB remains an attractive prospect for those seeking reliable dividend income.
Overview 📊
The sector for SLB N.V. is multifaceted, with a focus on maintaining robust cash flow to support its dividend policy. The current dividend yield is 2.27%, driven by a per-share dividend of $1.13. Notably, SLB boasts a 45-year history without any recent cuts, underscoring its reliability.
| Metric | Value |
|---|---|
| Sector | Energy |
| Dividend yield | 2.27% |
| Current dividend per share | 1.13 USD |
| Dividend history | 45 years |
| Last cut or suspension | None |
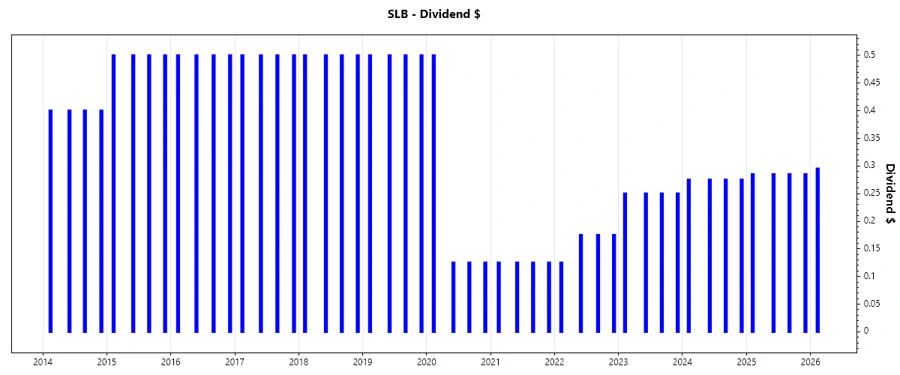
Dividend History 📈
SLB's uninterrupted dividend track record signifies its stability and commitment to shareholder returns, crucial for long-term investors. Understanding historical dividends allows stakeholders to evaluate consistency during varied economic cycles.
| Year | Dividend per Share (USD) |
|---|---|
| 2026 | 0.295 |
| 2025 | 1.140 |
| 2024 | 1.100 |
| 2023 | 1.00 |
| 2022 | 0.650 |
Dividend Growth ✅
The growth in dividends over the past three to five years reveals SLB's progressive approach to enhancing shareholder value. This evaluation provides insight into the company's long-term financial strategy and profitability rise.
| Time | Growth |
|---|---|
| 3 years | 20.60% |
| 5 years | 5.43% |
The average dividend growth is 5.43% over 5 years. This shows moderate but steady dividend growth, reflecting SLB's financial resilience and shareholder-focused strategies.
Payout Ratio 🗣️
Payout ratios provide clarity on how earnings and free cash flow support dividend payouts, ensuring sustainability without jeopardizing reinvestment opportunities.
| Key figure ratio | Percentage |
|---|---|
| EPS-based | 49.50% |
| Free cash flow-based | 41.82% |
The EPS payout ratio of 49.50% indicates a balanced approach between rewarding shareholders and reinvesting income. The FCF payout ratio of 41.82% further underscores fiscal prudence, facilitating steady dividend sustainability.
Cashflow & Capital Efficiency 💰
Evaluating cash flows and capital efficiency gives insights into SLB's operational success and investment return potential, pivotal for strategic growth and dividend payments.
| Year | 2025 | 2024 | 2023 |
|---|---|---|---|
| Free Cash Flow Yield | 8.79% | 8.21% | 6.13% |
| Earnings Yield | 6.19% | 8.19% | 5.67% |
| CAPEX to Operating Cash Flow | 26.11% | 32.25% | 31.52% |
| Stock-based Compensation to Revenue | 0.93% | 0.87% | 0.88% |
| Free Cash Flow / Operating Cash Flow Ratio | 73.89% | 67.75% | 68.48% |
| Return on Invested Capital | 8.85% | 13.74% | 12.47% |
The data reflects SLB's robust cash flow generation and capital allocation efficiency, crucial for maintaining investment flexibility and sustaining dividend growth.
Balance Sheet & Leverage Analysis 🍃
A company's balance sheet and leverage ratios offer insights into its financial health and ability to service debt, vital for long-term operational stability and dividend capacity.
| Year | 2025 | 2024 | 2023 |
|---|---|---|---|
| Debt-to-Equity | 0.32 | 0.57 | 0.59 |
| Debt-to-Assets | 0.24 | 0.25 | 0.25 |
| Debt-to-Capital | 0.24 | 0.36 | 0.37 |
| Net Debt to EBITDA | 1.36 | 1.06 | 1.20 |
| Current Ratio | 6.43 | 1.45 | 1.32 |
| Quick Ratio | 4.63 | 1.11 | 0.99 |
| Financial Leverage | 1.34 | 2.32 | 2.38 |
These figures confirm SLB's strong balance sheet leverage, underscoring its capacity to manage obligations and support strategic ambitions without compromising on dividends.
Fundamental Strength & Profitability 📈
Fundamental strength and profitability reflect SLB's operating efficiency and market position, influencing future growth and long-term dividend strategy.
| Year | 2025 | 2024 | 2023 |
|---|---|---|---|
| Return on Equity | 9.15% | 21.11% | 20.82% |
| Return on Assets | 6.83% | 9.12% | 8.76% |
| Net Margin | 9.45% | 12.29% | 12.68% |
| EBIT Margin | - | 17.04% | 17.46% |
| EBITDA Margin | 15.29% | 22.24% | 22.77% |
| Gross Margin | 18.22% | 20.56% | 19.81% |
| R&D to Revenue | 1.99% | 2.06% | 2.15% |
SLB's robust profitability measures and efficiency highlight its industry-leading capabilities, facilitating ongoing revenue growth and sustainable dividend practices.
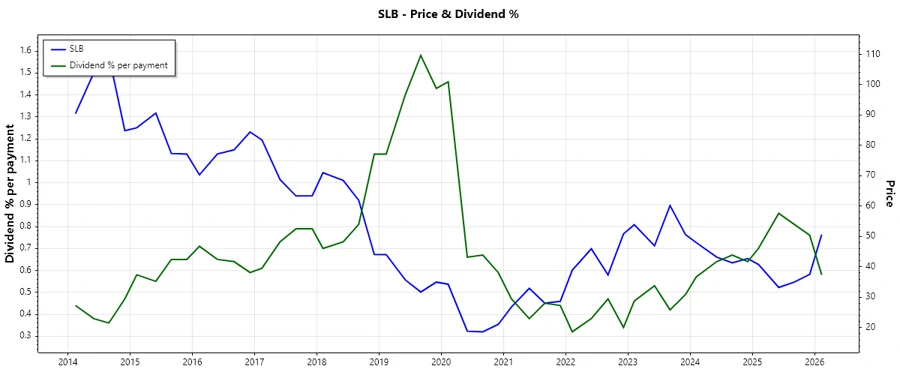
Price Development 📉
Dividend Scoring System 📋
| Criterion | Rating | Score |
|---|---|---|
| Dividend Yield | ★★★☆☆ | |
| Dividend Stability | ★★★★☆ | |
| Dividend Growth | ★★★☆☆ | |
| Payout Ratio | ★★★★☆ | |
| Financial Stability | ★★★★☆ | |
| Dividend Continuity | ★★★★★ | |
| Cashflow Coverage | ★★★☆☆ | |
| Balance Sheet Quality | ★★★★☆ |
Overall Score: 30/40
Rating 🌟
In conclusion, SLB showcases a resilient dividend framework appealing to long-term investors. With strong financial health, consistent dividend history, and steady growth potential, its overall stability suggests a sound income-generating investment opportunity. We recommend SLB for income investors seeking security and reliability alongside moderate capital appreciation prospects.