November 04, 2025 a 12:47 pm
SLB: Dividend Analysis - SLB N.V.
SLB N.V. presents a reliable dividend profile with a consistent dividend history spanning 44 years and a current yield of approximately 3.08%. Investors should note the recent reduction in dividends during 2021, reflecting potential volatility. However, the company's commitment to maintaining dividend payouts is apparent despite economic challenges.
📊 Overview
SLB N.V. operates within the Oilfield Services/Equipment sector, providing a robust dividend yield and demonstrating a capacity to sustain dividend payments over decades. Despite a cut in 2021, the ability to offer a yield of 3.08% keeps it attractive for dividend-focused investors.
| Detail | Value |
|---|---|
| Sector | Oilfield Services/Equipment |
| Dividend yield | 3.08% |
| Current dividend per share | 1.08 USD |
| Dividend history | 44 years |
| Last cut or suspension | 2021 |
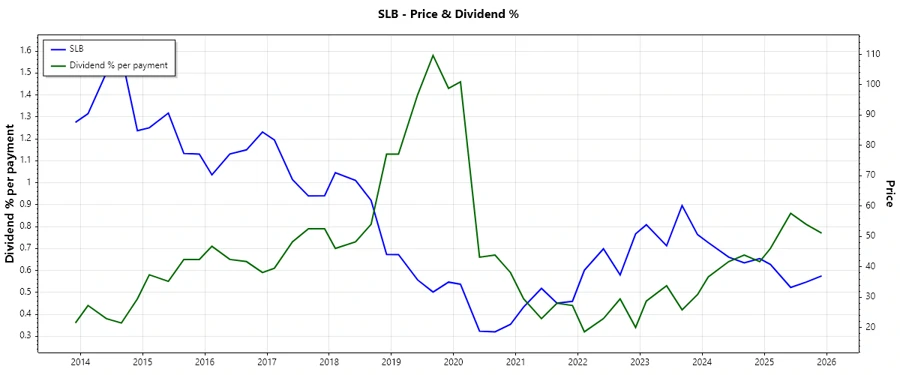
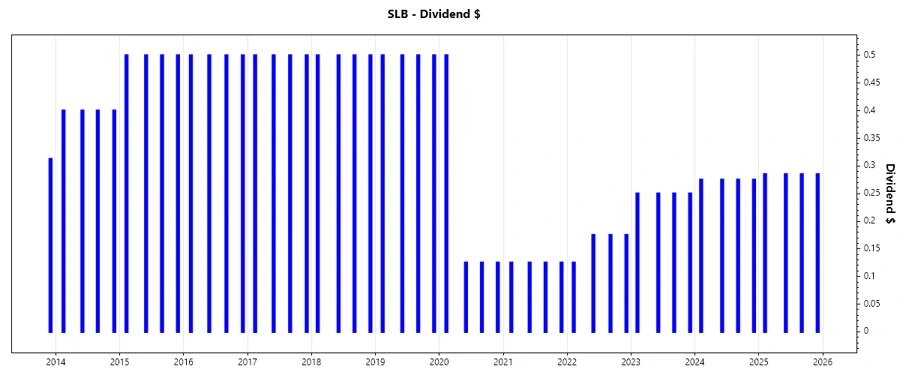
🗣️ Dividend History
SLB N.V. has showcased its resilience through its extensive dividend history. These dividends are not only income sources but are indicators of the company's financial health. A review of past dividends reveals a challenging period in 2021 but also highlights recovery with recent increases.
| Year | Dividend per Share (USD) |
|---|---|
| 2025 | 1.14 |
| 2024 | 1.10 |
| 2023 | 1.00 |
| 2022 | 0.65 |
| 2021 | 0.50 |
📈 Dividend Growth
The growth of dividends over time is a significant factor when assessing the future income potential from dividends. Notably, SLB N.V.'s dividend growth reflects volatility with a negative growth rate over five years.
| Time | Growth |
|---|---|
| 3 years | 0.30% |
| 5 years | -0.11% |
The average dividend growth is -0.11% over 5 years. This shows moderate challenges in maintaining dividend growth, which may concern prospective investors.
📉 Payout Ratio
A company's payout ratio sheds light on sustainability. SLB N.V. shows a payout ratio based on EPS of 43.54%, suggesting a conservative approach. The payout based on free cash flow is 39.99%, underlining efficient cash management.
| Key figure | Ratio |
|---|---|
| EPS-based | 43.54% |
| Free cash flow-based | 39.99% |
With a moderate payout ratio, SLB N.V. maintains a balance between rewarding shareholders and retaining earnings for potential future growth opportunities.
✅ Cashflow & Capital Efficiency
Capital efficiency and cash flow analysis together form a clearer picture of operational health. SLB N.V. offers a free cash flow yield of 7.29%, while maintaining suitable earnings yield metrics.
| Metric | 2022 | 2023 | 2024 |
|---|---|---|---|
| Free Cash Flow Yield | 2.65% | 6.13% | 8.21% |
| Earnings Yield | 4.55% | 5.67% | 8.19% |
| CAPEX to Operating Cash Flow | 46.1% | 31.5% | 32.2% |
| Stock-based Compensation to Revenue | 1.11% | 0.88% | 0.87% |
| Free Cash Flow / Operating Cash Flow Ratio | 53.9% | 68.5% | 67.8% |
The company demonstrates an efficient cash flow mechanism, underlined by growth in earnings and free cash flow, indicating a potential for future dividend reliability and capital investments.
⚠️ Balance Sheet & Leverage Analysis
Inspections of SLB N.V.'s balance sheet and leverage reveal how the company manages its financial structure and risks. Debt-to-equity ratios are consistently under control, with improvements in liquidity ratios across the years enhancing financial stability.
| Metric | 2022 | 2023 | 2024 |
|---|---|---|---|
| Debt-to-Equity | 0.69 | 0.59 | 0.61 |
| Debt-to-Assets | 0.28 | 0.25 | 0.26 |
| Debt-to-Capital | 0.41 | 0.37 | 0.38 |
| Net Debt to EBITDA | 1.64 | 1.20 | 1.15 |
| Current Ratio | 1.25 | 1.33 | 1.45 |
| Quick Ratio | 0.92 | 1.00 | 1.11 |
| Financial Leverage | 2.44 | 2.38 | 2.32 |
Improving leverage ratios augur well for long-term viability as they indicate better handling of debts relative to equity and assets.
📊 Fundamental Strength & Profitability
Profitability metrics provide insights into a company's actual performance beyond revenue figures. SLB N.V. shows stable returns on equity and assets, reflecting the company's effectiveness in generating profits with shareholders' investments.
| Metric | 2022 | 2023 | 2024 |
|---|---|---|---|
| Return on Equity | 19.46% | 20.82% | 21.11% |
| Return on Assets | 7.98% | 8.76% | 9.12% |
| Margins: Net | 12.25% | 12.68% | 12.29% |
| Margins: EBIT | 16.95% | 17.46% | 17.04% |
| Margins: EBITDA | 22.89% | 22.77% | 22.24% |
| Margins: Gross | 18.37% | 19.81% | 20.56% |
| Research & Development to Revenue | 2.26% | 2.15% | 2.06% |
With high profitability and stable metals across the board, SLB N.V.'s operations appear effectively managed, appealing to investors focused on financial gains.
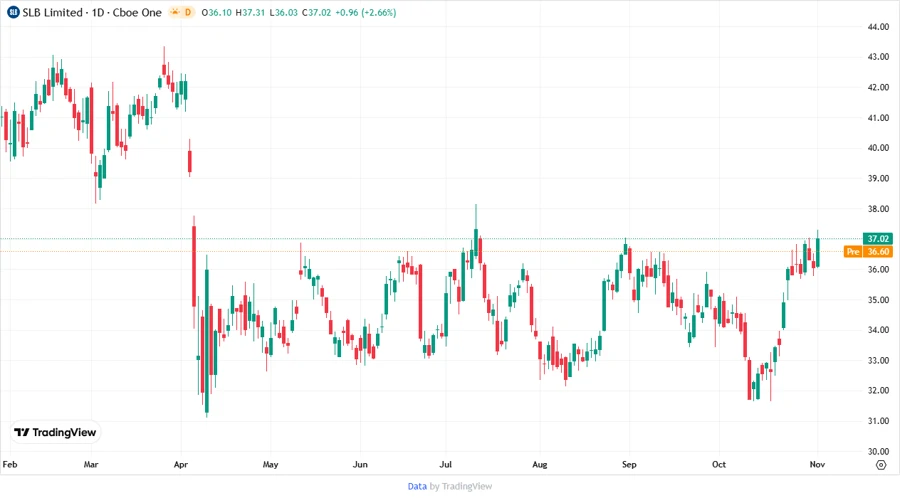
Price Development
🎯 Dividend Scoring System
| Criteria | Description | Score |
|---|---|---|
| Dividend yield | 3.08% | 3 |
| Dividend Stability | 44 years history | 4 |
| Dividend growth | -0.11% over 5 years | 1 |
| Payout ratio | 43.54% EPS-based | 4 |
| Financial stability | Improving leverage | 4 |
| Dividend continuity | Continued post 2021 | 3 |
| Cashflow Coverage | Efficient cash management | 4 |
| Balance Sheet Quality | Consistent improvement | 4 |
Overall Score: 27/40
Final Rating
SLB N.V. demonstrates solid performance regarding dividend stability and financial management, although recent years reflect some challenges in dividend growth. As the company continues its path of structured financial health and operational improvements, it serves as a promising option for income-seeking investors willing to navigate potential fluctuations.
Smart Data Insight
Master the Perfect Entry & Exit for this Stock
Don't leave your profits to chance. Historically, this stock follows specific seasonal patterns that institutional traders use to maximize returns.
- ✅ Identify the "Golden Buying Window"
- ✅ Avoid high-risk correction cycles
- ✅ Backtested data from the last 20+ years