May 08, 2026 a 01:15 pm

SJM: Trend and Support & Resistance Analysis - The J. M. Smucker Company
The J. M. Smucker Company, a globally recognized brand in the food and beverage industry, has shown recent fluctuation in its stock prices, but maintains a strong market presence. The technical analysis of SJM demonstrates the stock's recent trend and critical support and resistance zones. Investors should consider both the bullish and bearish technical signs to make informed decisions. Let's delve into the detailed analysis using the latest data.
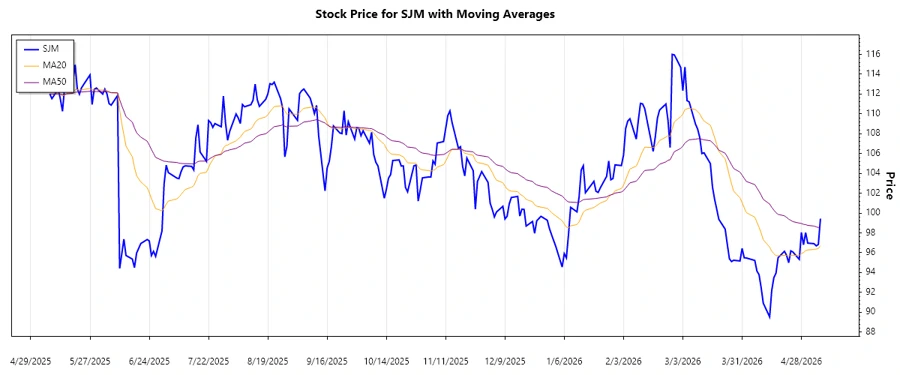
Trend Analysis
The analysis of SJM's price data shows mixed signals over the recent periods. By calculating the Exponential Moving Averages (EMA), we observe:
| Date | Close Price | Trend |
|---|---|---|
| 2026-05-07 | 99.44 | ▲ |
| 2026-05-06 | 96.83 | ▼ |
| 2026-05-05 | 96.69 | ▼ |
| 2026-05-04 | 96.91 | ⚖️ |
| 2026-05-01 | 96.97 | ⚖️ |
| 2026-04-30 | 98.03 | ▲ |
| 2026-04-29 | 96.8 | ▼ |
By examining the EMAs, we see that EMA20 is currently converging towards EMA50, suggesting potential shift towards a sideways movement. The recent data indicates potential underpinning of an upward trend. Investors should watch for clear breakout above the current ranges for confirmation.
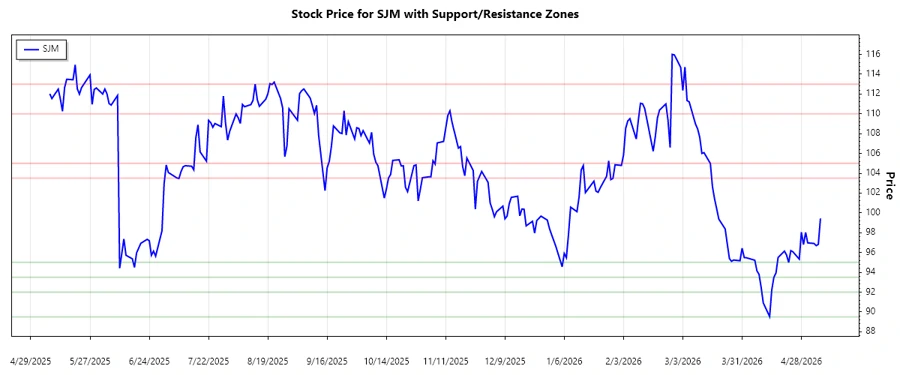
Support and Resistance
SMJ stocks show the following support and resistance zones based on the recent price analysis:
| Zone Type | From | To |
|---|---|---|
| Support | 93.49 | 95.00 |
| Support | 89.50 | 92.00 |
| Resistance | 103.50 | 105.00 |
| Resistance | 110.00 | 113.00 |
The current price of 99.44 is between support and resistance. Should the price breach above the nearby resistance, it could move toward the higher resistance levels. Conversely, a drop below the support could lead to further downwards momentum. Traders should monitor these levels closely for potential entry or exit points.
Conclusion
While SJM displays potential for upward movement, traders should remain cautious due to nearby resistance levels. The EMAs' near convergence indicates possible sideways motion unless a breakout occurs. Positive signs include strong market presence and diversified product offerings which could buffer the stock against volatility. However, broader economic factors and market sentiment could sway SJM's performance. Investors should consider both technical and fundamental analysis before making investment decisions.
Smart Data Insight
Master the Perfect Entry & Exit for this Stock
Don't leave your profits to chance. Historically, this stock follows specific seasonal patterns that institutional traders use to maximize returns.
- ✅ Identify the "Golden Buying Window"
- ✅ Avoid high-risk correction cycles
- ✅ Backtested data from the last 20+ years