September 15, 2025 a 03:15 am


SJM: Trend and Support & Resistance Analysis - The J. M. Smucker Company
SJM shows a dynamic stock performance within the consumer foods and pet product sectors. The company's recent stock movements reflect robust market activities influenced by consumer demand and external economic factors. A detailed analysis of its recent trend and support-resistance levels can provide investors with insights into potential opportunities and risks. This technical evaluation aims to outline the possible direction and key areas of interest for SJM's stock price.
Trend Analysis
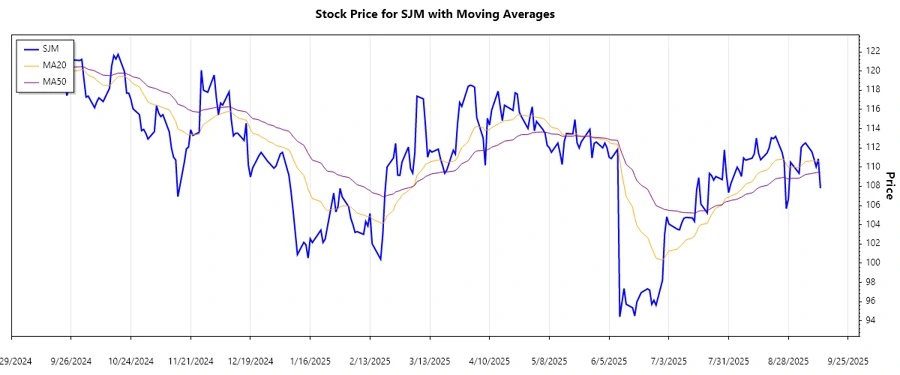
The analysis of SJM's recent daily closing prices indicates a shifting momentum in the stock's price movements. Based on calculated EMA20 and EMA50, the trend direction can be elucidated as follows:
| Date | Close Price | Trend |
|---|---|---|
| 2025-09-12 | 107.8 | ▼ Downtrend |
| 2025-09-11 | 110.86 | ▼ Downtrend |
| 2025-09-10 | 110.03 | ▼ Downtrend |
| 2025-09-09 | 110.85 | ▼ Downtrend |
| 2025-09-08 | 111.59 | ▲ Uptrend |
| 2025-09-05 | 112.51 | ▲ Uptrend |
| 2025-09-04 | 112.34 | ▲ Uptrend |
The calculation of EMA indicates a potential reversion between short and long-term average, suggesting a trending shift. Based on the recent data, the dominant trend is a relatively mild downtrend; however, the uptrend observed over multiple days implies possible stabilization or reversal.
Support and Resistance
Support and resistance levels are crucial for understanding potential reversals or continuations in price movements. In SJM's current stock trajectory, key zones have been identified:
| Zone Type | From | To |
|---|---|---|
| Support Zone 1 | 106.00 | 108.00 |
| Support Zone 2 | 103.00 | 105.00 |
| Resistance Zone 1 | 112.00 | 114.00 |
| Resistance Zone 2 | 116.00 | 118.00 |
Currently, the price sits near a crucial zone, suggesting limited movement without additional market catalysts. Nevertheless, these zones are essential for traders to consider as the stock approaches these levels.
Conclusion
SJM has demonstrated an intricate price movement with signs of both upward and downward pressures within the marketplace. As the stock currently flirts with pivotal price zones, analysts should consider both historical resistance and support levels in their evaluations. While the short-term trend appears slightly downwards, a distinct potential for positive movement exists if resistance breakthroughs are achieved. Investors must weigh these analyses carefully within their broader strategies, considering the company's market context and forecasts.
Smart Data Insight
Master the Perfect Entry & Exit for this Stock
Don't leave your profits to chance. Historically, this stock follows specific seasonal patterns that institutional traders use to maximize returns.
- ✅ Identify the "Golden Buying Window"
- ✅ Avoid high-risk correction cycles
- ✅ Backtested data from the last 20+ years