
July 19, 2026 a 07:46 am


SJM: Dividend Analysis - The J. M. Smucker Company
The J. M. Smucker Company, with a deeply rooted history of 33 years of uninterrupted dividend payments, boasts a robust 4.38% dividend yield. While its recent challenges impact some financial ratios negatively, its historic dividend continuity and steady growth over five years deem it a noteworthy candidate for income-focused portfolios.
📊 Overview
The J. M. Smucker Company operates in the Consumer Staples sector and offers a compelling dividend yield of 4.38%, which is attractive for income-focused investors. With a current dividend per share of $4.36 and a notable history of uninterrupted dividends for 33 years, the company's commitment to returning value to shareholders is evident. The absence of recent dividend cuts further solidifies its stable payout history.
| Metric | Value |
|---|---|
| Sector | Consumer Staples |
| Dividend Yield | 4.38% |
| Current Dividend Per Share | $4.36 |
| Dividend History | 33 years |
| Last Cut or Suspension | None |
🗣️ Dividend History
The impressive tradition of 33 years of continuous dividend payments signifies the resilience and financial discipline of The J. M. Smucker Company. The consistent payouts enhance shareholder value and reflect sound financial governance.
| Year | Dividend Per Share (USD) |
|---|---|
| 2026 | 2.20 |
| 2025 | 4.36 |
| 2024 | 4.28 |
| 2023 | 4.16 |
| 2022 | 4.02 |
📈 Dividend Growth
Dividend growth rates are crucial for income investors as they indicate the management's confidence in future earnings and cash flows. The J. M. Smucker Company has shown moderate dividend growth over the last years, reflecting its ability to increase shareholder returns consistently.
| Time | Growth |
|---|---|
| 3 years | 2.74% |
| 5 years | 4.14% |
The average dividend growth is 4.14% over 5 years. This shows moderate but steady dividend growth.
🧮 Payout Ratio
Payout ratios are a critical measure of a company's financial health, indicating how much profit is used to pay dividends. The J. M. Smucker Company's EPS-based payout ratio is currently negative, which suggests potential challenges, while the FCF-based ratio remains lower, presenting a more stable outlook.
| Key Figure | Ratio |
|---|---|
| EPS-based | -335.04% |
| Free Cash Flow-based | 40.26% |
The EPS-based payout ratio is markedly negative, revealing that current earnings do not support the dividend payout. However, the FCF-based ratio at 40.26% indicates a more sustainable dividend payment capacity.
💵 Cashflow & Capital Efficiency
Analyzing cash flows and capital efficiency provides insight into how effectively a company uses its resources to generate cash. Key metrics like Free Cash Flow Yield and CAPEX to Operating Cash Flow ratios offer visibility into operational efficiency and long-term sustainability.
| Year | 2026 | 2025 | 2024 |
|---|---|---|---|
| Free Cash Flow Yield | 11.05% | 6.60% | 5.38% |
| Earnings Yield | -1.33% | -9.95% | 6.22% |
| CAPEX to Operating Cash Flow | 21.54% | 32.53% | 47.71% |
| Stock-based Compensation to Revenue | 0.26% | 0.34% | 0.29% |
| Free Cash Flow / Operating Cash Flow Ratio | 78.46% | 67.47% | 52.29% |
The free cash flow position appears stable, being less sensitive to earnings fluctuations, while CAPEX investments signal continued future growth ambitions.
📊 Balance Sheet & Leverage Analysis
Leverage ratios help assess the financial stability and risk level of a company. The J. M. Smucker Company shows a considerable amount of debt compared to its equity, but maintains an acceptable current and quick ratio, which highlights its liquid assets sufficiency to cover near-term liabilities.
| Year | 2026 | 2025 | 2024 |
|---|---|---|---|
| Debt-to-Equity | 1.28 | 1.28 | 1.11 |
| Debt-to-Assets | 43.71% | 44.19% | 42.16% |
| Debt-to-Capital | 56.12% | 56.06% | 52.63% |
| Net Debt to EBITDA | 13.28 | -49.43 | 5.01 |
| Current Ratio | 0.78 | 0.81 | 0.52 |
| Quick Ratio | 0.33 | 0.35 | 0.25 |
| Financial Leverage | 2.93 | 2.89 | 2.64 |
The company's leverage ratios suggest moderate financial risk with steps taken towards debt reduction, although further improvement, particularly in debt load, is needed for long-term financial strength.
🔎 Fundamental Strength & Profitability
Fundamental metrics are crucial in assessing the profitability and efficiency of a company's operations. Return on equity and asset ratios, along with various profit margins, offer insights into The J. M. Smucker Company's operational performance and strategy effectiveness.
| Year | 2026 | 2025 | 2024 |
|---|---|---|---|
| Return on Equity | -2.50% | -20.23% | 9.67% |
| Return on Assets | -0.86% | -7.01% | 3.67% |
| Net Margin | -1.53% | -14.10% | 9.10% |
| EBIT Margin | 3.52% | -7.54% | 15.41% |
| EBITDA Margin | 5.85% | -1.78% | 20.68% |
| Gross Margin | 33.53% | 38.79% | 38.09% |
| Research & Development to Revenue | 0% | 0% | 0% |
The declining return metrics indicate challenges in profitability, while the robust gross margin signifies effective cost management. Absence of R&D spending may limit innovation potential.
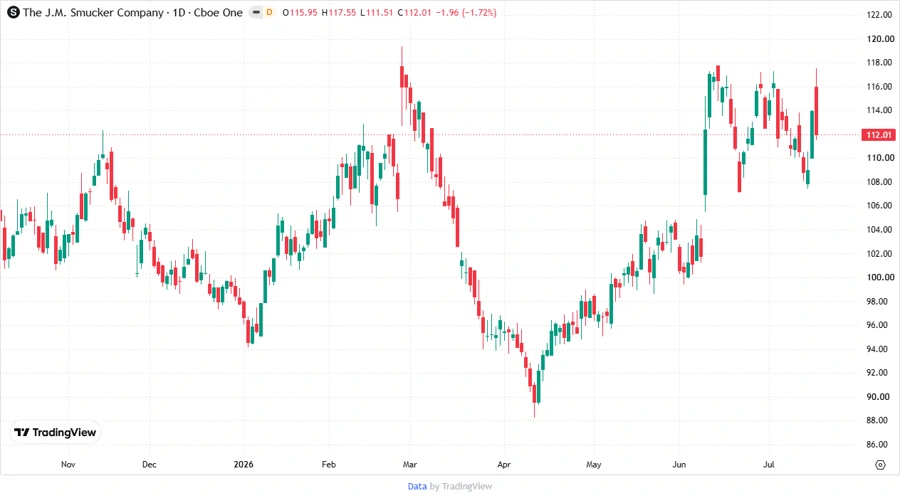
📉 Price Development
Dividend Scoring System
| Category | Score | |
|---|---|---|
| Dividend Yield | 4 | |
| Dividend Stability | 5 | |
| Dividend Growth | 3 | |
| Payout Ratio | 2 | |
| Financial Stability | 3 | |
| Dividend Continuity | 5 | |
| Cashflow Coverage | 3 | |
| Balance Sheet Quality | 3 |
Total Score: 28/40
✅ Rating
The J. M. Smucker Company presents a mixed dividend profile with a strong yield and impressive history of dividend stability. However, financial metrics highlight areas needing improvement, particularly in profitability and leverage. While prospective investors may appreciate the steadfast dividend, monitoring financial health improvements would be prudent before substantial commitment. Overall, it remains a viable option for investors emphasizing income, with potential for future capital appreciation contingent on financial restructuring.
Smart Data Insight
Master the Perfect Entry & Exit for this Stock
Don't leave your profits to chance. Historically, this stock follows specific seasonal patterns that institutional traders use to maximize returns.
- ✅ Identify the "Golden Buying Window"
- ✅ Avoid high-risk correction cycles
- ✅ Backtested data from the last 20+ years