
July 18, 2026 a 07:31 am


SJM: Dividend Analysis - The J. M. Smucker Company
The J. M. Smucker Company stands out as a unique option within the dividend investing universe due to its established history of dividend payouts and moderate growth potential. Investors should be aware of its recent financial struggles, impacting its payout ratios negatively. Despite this, the company's long-standing tradition of consistent dividends presents a stable opportunity for income-focused portfolios.
📊 Overview
The J. M. Smucker Company operates within a resilient sector, offering a dividend yield that captures investors' interest. Notably, their dividend history showcases an impressive 33 years of continuous payouts, speaking to their commitment to returning value to shareholders.
| Metric | Value |
|---|---|
| Sector | Consumer Packaged Goods |
| Dividend yield | 4.38% |
| Current dividend per share | 4.36 USD |
| Dividend history | 33 years |
| Last cut or suspension | None |
🗣️ Dividend History
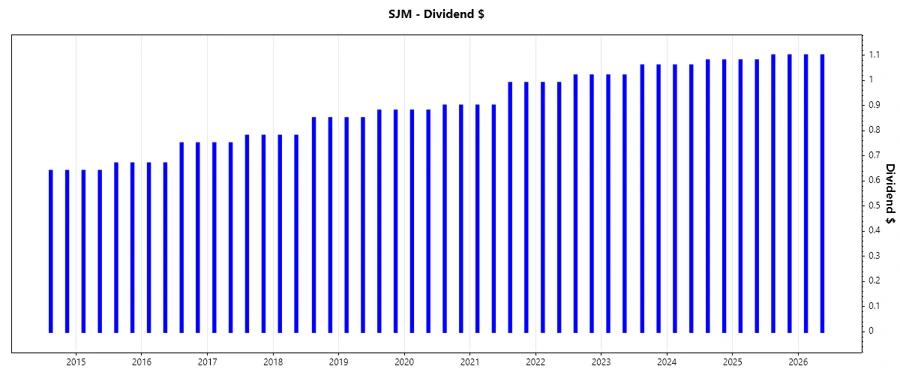
The consistency of The J. M. Smucker’s dividend payments is a testament to its ongoing commitment to shareholders. Understanding the past dividend payouts is crucial as it helps investors gauge future stability and growth potential.
| Year | Dividend per Share (USD) |
|---|---|
| 2026 | 2.20 |
| 2025 | 4.36 |
| 2024 | 4.28 |
| 2023 | 4.16 |
| 2022 | 4.02 |
📈 Dividend Growth
Assessing Dividend Growth is essential for investors aiming at income enhancement over time. The J. M. Smucker Company shows moderate but steady dividend growth, reflecting its financial health and strategic focus to enhance shareholder returns.
| Time | Growth |
|---|---|
| 3 years | 2.74% |
| 5 years | 4.14% |
The average dividend growth is 4.14% over 5 years. This shows moderate but steady dividend growth.
📉 Payout Ratio
The Payout Ratio is an indicator of sustainability in dividend payouts. Currently, SJM's payout ratio based on EPS is negative, suggesting inadequate earnings to cover dividends from profit alone. However, the Free Cash Flow based payout ratio remains in a more stable zone, indicating cash flow sufficiency.
| Key figure ratio | Value |
|---|---|
| EPS-based | -335.04% |
| Free cash flow-based | 40.26% |
The negative EPS-based payout ratio indicates the company is using alternative sources other than earnings to maintain its dividend, posing potential risks if sustained long-term.
✅ Cashflow & Capital Efficiency
Cashflow and capital efficiency reflect how well a company manages its operations to generate cash and invest profits effectively. These metrics directly influence its ability to cover dividends with cash flows.
| Metric | 2026 | 2025 | 2024 |
|---|---|---|---|
| Free Cash Flow Yield | 11.05% | 6.60% | 5.38% |
| Earnings Yield | -1.33% | -9.95% | 6.22% |
| CAPEX to Operating Cash Flow | 21.54% | 32.53% | 47.71% |
| Stock-based Compensation to Revenue | 0.26% | 0.34% | 0.29% |
| Free Cash Flow / Operating Cash Flow Ratio | 78.46% | 67.47% | 52.29% |
The Free Cash Flow Yield indicates potential value to shareholders, while the CAPEX to Operating Cash Flow ratio suggests an increase in capital expenses impacting cash available for dividends.
📊 Balance Sheet & Leverage Analysis
Leverage ratios serve as indicators of financial risk and stability, demonstrating the company's handling of debts in relation to its assets and equity.
| Metric | 2026 | 2025 | 2024 |
|---|---|---|---|
| Debt-to-Equity | 1.28 | 1.28 | 1.11 |
| Debt-to-Assets | 43.71% | 44.19% | 42.16% |
| Debt-to-Capital | 56.12% | 56.06% | 52.63% |
| Net Debt to EBITDA | 6.85 | -49.43 | 5.02 |
| Current Ratio | 0.78 | 0.81 | 0.52 |
| Quick Ratio | 0.33 | 0.35 | 0.25 |
The relatively high leverage ratios indicate a significant level of debt, which could constrain financial flexibility, emphasizing the importance of cash flow management.
📊 Fundamental Strength & Profitability
Understanding the underlying profitability and efficiency ratios offers insights about the company's ability to generate profits relative to its operations and assets used.
| Metric | 2026 | 2025 | 2024 |
|---|---|---|---|
| Return on Equity | -2.50% | -20.23% | 9.67% |
| Return on Assets | -0.86% | -7.01% | 3.67% |
| Net Profit Margin | -1.53% | -14.10% | 9.10% |
| EBIT Margin | 3.52% | -7.54% | 15.41% |
| EBITDA Margin | 5.85% | -1.78% | 20.68% |
| Gross Margin | 33.53% | 38.79% | 38.09% |
| Research & Development to Revenue | 0% | 0% | 0% |
The company's profitability metrics indicate a mixed performance with significant losses in recent years, signaling potential operational and financial restructuring needs.
📊 Price Development
✅ Dividend Scoring System
| Category | Score | Score Bar |
|---|---|---|
| Dividend yield | 4 | |
| Dividend Stability | 3 | |
| Dividend growth | 3 | |
| Payout ratio | 2 | |
| Financial stability | 2 | |
| Dividend continuity | 4 | |
| Cashflow Coverage | 3 | |
| Balance Sheet Quality | 2 |
Overall Score: 23/40
⚠️ Rating
The J. M. Smucker Company's dividend profile in the current market offers parts to appreciate and risks to mitigate. On a positive note, the longstanding history of consistent dividends coupled with moderate yield presents a compelling case for dividend-seeking investors. However, negative payout ratios and recent financial challenges draw attention to caution, suggesting a close monitoring of the company's restructuring efforts and financial health improvements. A potential investment could be merited for risk-tolerant investors with an eye on future stabilization.
Smart Data Insight
Master the Perfect Entry & Exit for this Stock
Don't leave your profits to chance. Historically, this stock follows specific seasonal patterns that institutional traders use to maximize returns.
- ✅ Identify the "Golden Buying Window"
- ✅ Avoid high-risk correction cycles
- ✅ Backtested data from the last 20+ years