
June 11, 2026 a 03:31 am

SJM: Dividend Analysis - The J. M. Smucker Company
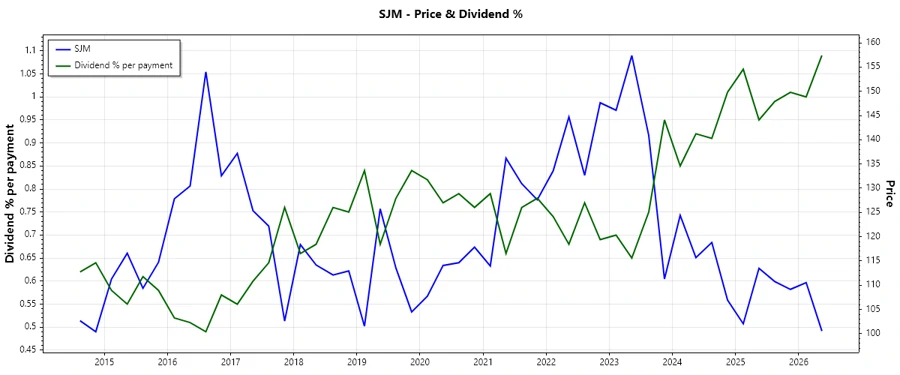
The J. M. Smucker Company showcases a robust dividend profile with a history of consistent payments and moderate growth. However, their recent earnings volatility raises caution regarding dividend sustainability. With a substantial market cap and a storied legacy of dividend continuity, it remains an intriguing option for income-focused investors, despite some financial headwinds.
Overview 📊
The dividend profile of The J. M. Smucker Company reflects a stable income strategy with long-standing credibility in the consumer staples sector.
| Metric | Detail |
|---|---|
| Sector | Consumer Staples |
| Dividend Yield | 4.38 % |
| Current Dividend Per Share | 4.36 USD |
| Dividend History | 33 years |
| Last Cut/Suspension | None |
Dividend History 📈
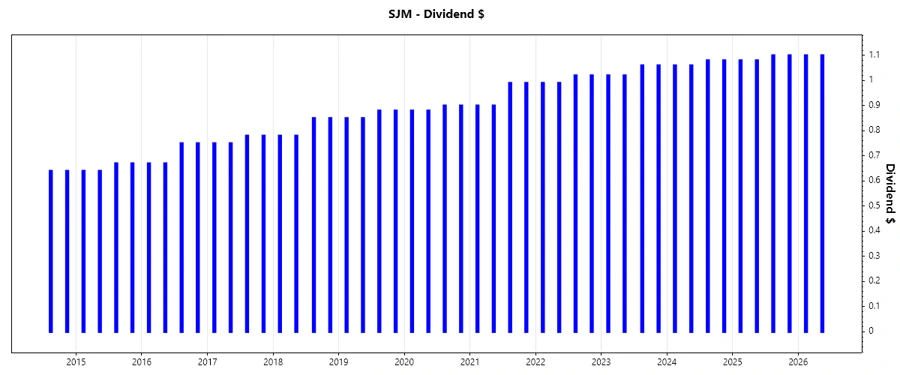
A consistent payout record enhances investor confidence, reflecting stability and reliability. However, historical dividends must be balanced against recent EPS performance to ensure ongoing feasibility.
| Year | Dividend Per Share (USD) |
|---|---|
| 2026 | 2.2 |
| 2025 | 4.36 |
| 2024 | 4.28 |
| 2023 | 4.16 |
| 2022 | 4.02 |
Dividend Growth 📊
Examining dividend growth highlights the company's ability to enhance shareholder value over time, despite financial fluctuations.
| Time | Growth |
|---|---|
| 3 years | 2.74 % |
| 5 years | 4.14 % |
The average dividend growth is 4.14 % over 5 years. This shows moderate but steady dividend growth.
Payout Ratio 🗣️
The payout ratio analysis provides insight into the sustainability of dividends relative to earnings and cash flow, which is critical for assessing financial health.
| Key figure | Ratio |
|---|---|
| EPS-based | -335.04 % |
| Free cash flow-based | 40.17 % |
The EPS-based payout ratio indicates potential unsustainability, but the FCF ratio shows a more secure basis for dividends.
Cashflow & Capital Efficiency 📉
Thorough analysis of cash flow metrics signifies the company's liquidity strength and capital management efficiency, guiding long-term strategic decisions.
| Metric | 2026 | 2025 | 2024 |
|---|---|---|---|
| Free Cash Flow Yield | 11.05 % | 6.60 % | 5.38 % |
| Earnings Yield | -1.33 % | -9.95 % | 6.22 % |
| CAPEX to Operating Cash Flow | 21.54 % | 32.53 % | 47.71 % |
| Stock-based Compensation to Revenue | 0.26 % | 0.34 % | 0.29 % |
| Free Cash Flow / Operating Cash Flow Ratio | 78.46 % | 67.47 % | 52.29 % |
| Return on Invested Capital | 2.53 % | -4.33 % | 5.37 % |
Continued monitoring of cash flows and return measures reveals mixed signals on efficiency and liquidity management over the past years.
Balance Sheet & Leverage Analysis ⚠️
Leverage ratios and balance sheet metrics help determine financial structure robustness and risk exposure concerning liabilities.
| Metric | 2026 | 2025 | 2024 |
|---|---|---|---|
| Debt-to-Equity | 1.28 | 1.28 | 1.11 |
| Debt-to-Assets | 0.44 | 0.44 | 0.42 |
| Debt-to-Capital | 0.56 | 0.56 | 0.53 |
| Net Debt to EBITDA | 13.28 | -49.43 | 5.02 |
| Current Ratio | 0.78 | 0.81 | 0.52 |
| Quick Ratio | 0.33 | 0.35 | 0.25 |
| Financial Leverage | 2.93 | 2.89 | 2.63 |
High debt to EBITDA levels raise concerns about leverage, necessitating careful financial management to maintain solvency.
Fundamental Strength & Profitability 🏦
Scrutinizing profitability margins and returns on key financial metrics can pinpoint operational efficiency and compel strategic focus areas.
| Metric | 2026 | 2025 | 2024 |
|---|---|---|---|
| Return on Equity | -2.50 % | -20.23 % | 9.67 % |
| Return on Assets | -0.86 % | -7.01 % | 3.67 % |
| Net Margin | -1.53 % | -14.10 % | 9.10 % |
| EBIT Margin | 3.52 % | -7.54 % | 15.41 % |
| EBITDA Margin | 5.85 % | -1.78 % | 20.68 % |
| Gross Margin | 33.53 % | 38.79 % | 38.09 % |
| Research & Development to Revenue | 0 % | 0 % |
Profitability metrics demonstrate volatility, suggesting the need for cautious yet aggressive strategies to stabilize earnings.
Price Development 📈
Dividend Scoring System ✅
| Criteria | Score | Evaluation |
|---|---|---|
| Dividend Yield | 4 | |
| Dividend Stability | 5 | |
| Dividend Growth | 3 | |
| Payout Ratio | 2 | |
| Financial Stability | 2 | |
| Dividend Continuity | 5 | |
| Cashflow Coverage | 3 | |
| Balance Sheet Quality | 2 |
Overall Score: 26/40
Rating 🏆
Given its strong historical dividend continuity and decent yield, The J. M. Smucker Company remains a viable option for income investors. However, potential financial instability and leverage issues could present risks. It is recommended for those with moderate risk tolerance.
Smart Data Insight
Master the Perfect Entry & Exit for this Stock
Don't leave your profits to chance. Historically, this stock follows specific seasonal patterns that institutional traders use to maximize returns.
- ✅ Identify the "Golden Buying Window"
- ✅ Avoid high-risk correction cycles
- ✅ Backtested data from the last 20+ years