May 04, 2026 a 11:31 am
SJM: Dividend Analysis - The J. M. Smucker Company
The J. M. Smucker Company, a stalwart in maintaining shareholder returns through consistent dividend payouts for 33 years, exhibits a dividend yield of 4.54%. While the recent dividend per share remains stable, a dip in earnings calls for caution in monitoring payout sustainability. Its growth trajectory, despite economic pressures, showcases commendable dividend continuity.
📊 Overview
The overview provides insights into key financial health indicators of The J. M. Smucker Company, focusing on its sustained dividend yield and historical payment stability.
| Metrics | Data |
|---|---|
| Sector | Consumer Staples |
| Dividend Yield | 4.54% |
| Current Dividend per Share | 4.28 USD |
| Dividend History | 33 years |
| Last Cut or Suspension | None |
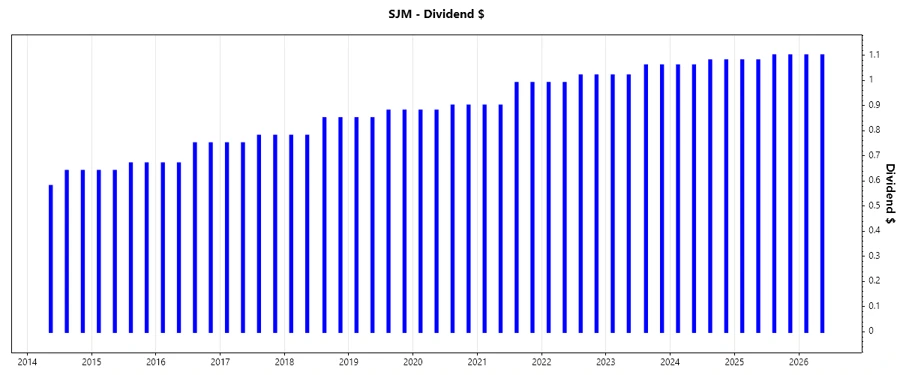
📈 Dividend History
The dividend history reflects The J. M. Smucker Company's resilience in maintaining dividend payments, crucial for income-focused investors.
| Year | Dividend per Share (USD) |
|---|---|
| 2026 | 2.20 |
| 2025 | 4.36 |
| 2024 | 4.28 |
| 2023 | 4.16 |
| 2022 | 4.02 |
📈 Dividend Growth
A review of the growth patterns in dividends provides an insight into the company’s commitment to enhancing shareholder value over the medium to long term.
| Time | Growth |
|---|---|
| 3 years | 2.74% |
| 5 years | 4.14% |
The average dividend growth is 4.14% over 5 years. This shows moderate but steady dividend growth.
⚠️ Payout Ratio
Payout ratios are vital in understanding dividend sustainability. They highlight potential strain on income allocation towards shareholder returns.
| Key Figure | Ratio |
|---|---|
| EPS-based | -36.37% |
| Free Cash Flow-based | 47.00% |
A negative EPS payout ratio indicates a potential concern in dividend coverage from earnings, whereas a free cash flow payout of 47% suggests more reliable sustainability.
💰 Cashflow & Capital Efficiency
Cashflow metrics measure the company’s operational efficiency and its ability to fund dividends and reinvest in the business. Capital efficiency ratios assess how effectively capital is deployed to generate income.
| Metrics | 2023 | 2024 | 2025 |
|---|---|---|---|
| Free Cash Flow Yield | 4.30% | 5.38% | 6.60% |
| Earnings Yield | -0.55% | 6.22% | -9.95% |
| CAPEX to Operating Cash Flow | 39.65% | 47.71% | 32.53% |
| Stock-based Compensation to Revenue | 0.30% | 0.29% | 0.34% |
| Free Cash Flow / Operating Cash Flow Ratio | 60.35% | 52.29% | 67.47% |
The company's cash flow analysis reflects strong free cash flow generation, crucial for sustaining operational needs and shareholder returns, despite fluctuating earnings yields.
📊 Balance Sheet & Leverage Analysis
A thorough examination of balance sheet ratios provides insight into the company's financial leverage and its ability to meet obligations.
| Metrics | 2023 | 2024 | 2025 |
|---|---|---|---|
| Debt-to-Equity | 0.61 | 1.11 | 1.28 |
| Debt-to-Assets | 29.51% | 42.16% | 44.19% |
| Debt-to-Capital | 37.77% | 52.63% | 56.06% |
| Net Debt to EBITDA | 6.57 | 5.02 | -49.43 |
| Current Ratio | 1.44 | 0.52 | 0.84 |
| Quick Ratio | 0.93 | 0.25 | 0.35 |
| Financial Leverage | 2.06 | 2.64 | 2.89 |
While debt ratios exhibit increased leverage, adequate liquidity ratios, such as the quick ratio, provide comfort in short-term financial stability.
📈 Fundamental Strength & Profitability
Profitability ratios are critical for assessing how effectively a company generates profit relative to revenue and equity.
| Metrics | 2023 | 2024 | 2025 |
|---|---|---|---|
| Return on Equity | -1.25% | 9.67% | -20.23% |
| Return on Assets | -0.61% | 3.67% | -7.01% |
| Net Margin | -1.07% | 9.10% | -14.10% |
| EBIT Margin | 1.67% | 15.41% | -7.54% |
| EBITDA Margin | 6.73% | 20.68% | -1.78% |
| Gross Margin | 32.85% | 38.09% | 38.79% |
| Research & Development to Revenue | 0% | 0% | 0% |
The volatility in profitability metrics reflects recent operational challenges. However, stable gross margins underscore effective cost management.
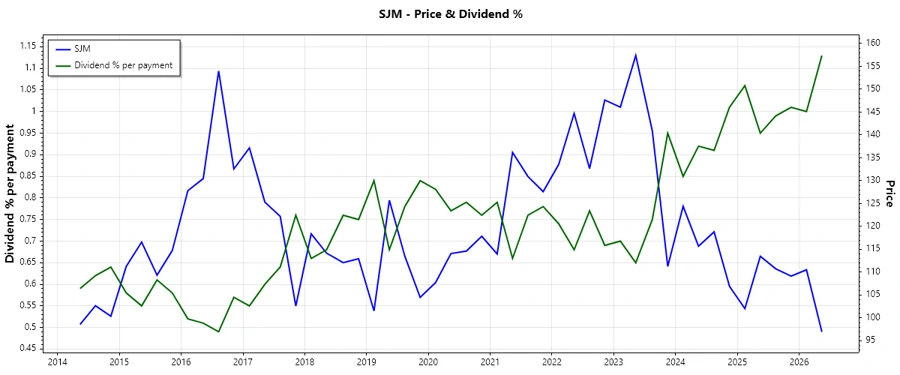
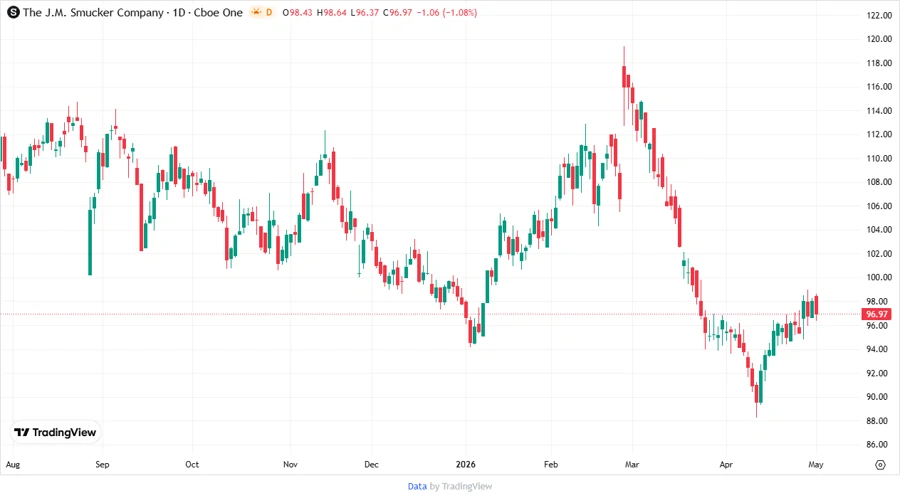
📉 Price Development
✅ Dividend Scoring System
| Category | Score | Score Bar |
|---|---|---|
| Dividend Yield | 4 | |
| Dividend Stability | 5 | |
| Dividend Growth | 3 | |
| Payout Ratio | 3 | |
| Financial Stability | 2 | |
| Dividend Continuity | 5 | |
| Cashflow Coverage | 4 | |
| Balance Sheet Quality | 2 |
Total Score: 28/40
📈 Rating
Overall, The J. M. Smucker Company presents a mixed dividend profile, characterized by strong historical performance and moderate growth potential. Investors should weigh the robust dividend yield against the implications of its fluctuating earnings and leverage metrics. Maintaining close attention to financial updates is advisable for income-focused investors.
Smart Data Insight
Master the Perfect Entry & Exit for this Stock
Don't leave your profits to chance. Historically, this stock follows specific seasonal patterns that institutional traders use to maximize returns.
- ✅ Identify the "Golden Buying Window"
- ✅ Avoid high-risk correction cycles
- ✅ Backtested data from the last 20+ years