March 21, 2026 a 03:31 pm

SJM: Dividend Analysis - The J. M. Smucker Company
The J.M. Smucker Company is a longstanding player in the consumer goods sector, boasting an impressive dividend history of stability and growth. The company's current dividend yield, coupled with its consistent payout record, make it an attractive option for income-focused investors. However, some volatility in its financial metrics warrants a deeper dive into its financial health.
📊 Overview
J.M. Smucker operates in the consumer goods sector, offering a nearly 4% dividend yield with a current dividend per share at $4.28. Notably, the company has an impressive 33-year history of dividend payments, showcasing stability. Its latest dividend action, such as any cuts or suspensions, remains negligible, last recorded as None. These factors contribute to its appeal to dividend-seeking investors.
| Metric | Value |
|---|---|
| Sector | Consumer Goods |
| Dividend yield | 3.96 % |
| Current dividend per share | 4.28 USD |
| Dividend history | 33 years |
| Last cut or suspension | None |
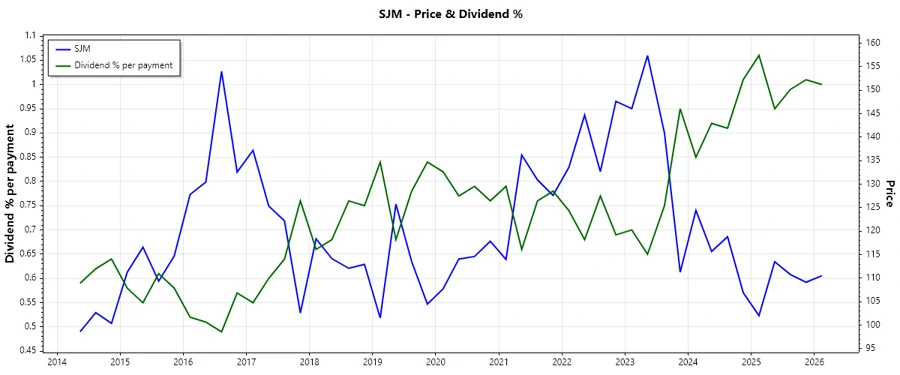
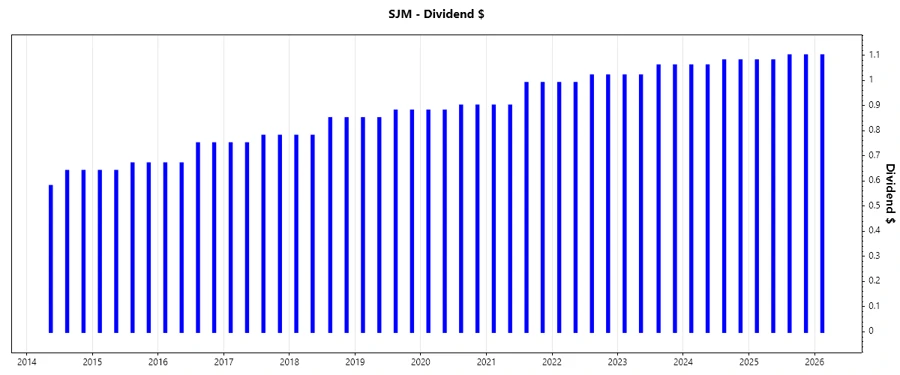
📉 Dividend History
The historical dividend growth of J.M. Smucker is indicative of its commitment to returning value to shareholders. This analysis not only showcases its reliability but also provides insights into future stability. It's crucial for potential investors to understand past trends as they often predict future performance.
| Year | Dividend Per Share (USD) |
|---|---|
| 2026 | 1.1 |
| 2025 | 4.36 |
| 2024 | 4.28 |
| 2023 | 4.16 |
| 2022 | 4.02 |
📈 Dividend Growth
The growth rates over 3 and 5 years are critical indicators of the company’s future dividend potential. A growth rate of 0.027% over 3 years and 4.14% over 5 years demonstrates a moderate but consistent upward trend, appealing for long-term investors.
| Time | Growth |
|---|---|
| 3 years | 2.74 % |
| 5 years | 4.14 % |
The average dividend growth is 4.14% over 5 years. This shows moderate but steady dividend growth.
✅ Payout Ratio
The earnings-based payout ratio is a critical measure of dividend sustainability, where a negative EPS-based ratio of -36.37% could raise concerns. However, the free cash flow-based payout ratio at 47.02% suggests a better coverage from operational cash flows.
| Key figure | Ratio |
|---|---|
| EPS-based | -36.37 % |
| Free cash flow-based | 47.02 % |
While the EPS-based payout ratio is negative, the FCF-based ratio is comfortably below 50%, indicating sustainable dividend payments from cash flow rather than earnings.
🗣️ Cashflow & Capital Efficiency
Evaluating cash flows and capital efficiency is essential for understanding operational productivity. The free cash flow yield of 9.16% underlines substantial cash generation. With a CAPEX to operating cash flow ratio of 24.61%, the company efficiently transforms cash into growth, balanced against minimal stock-based compensation impacts (0.28% to revenue).
| Year | Free Cash Flow Yield | Earnings Yield | CAPEX to Operating Cash Flow | Stock-based Compensation to Revenue | Free Cash Flow / Operating Cash Flow Ratio |
|---|---|---|---|---|---|
| 2025 | 6.60% | -9.95% | 32.53% | 0.34% | 67.47% |
| 2024 | 5.38% | 6.22% | 47.71% | 0.29% | 52.29% |
| 2023 | 4.30% | -0.55% | 39.65% | 0.30% | 60.35% |
The stable cash flow yields and capital efficiency metrics signal a robust ability to sustain dividend policies and reinvestment strategies.
⚠️ Balance Sheet & Leverage Analysis
Understanding leverage and solvency ratios indicates financial stability and debt handling capabilities. J.M. Smucker's debt-to-equity ratio fluctuates, with 1.28 in 2025 indicative of moderate leverage. Ratios like the current and quick ratios, although below 1, require close monitoring for liquidity.
| Year | Debt-to-Equity | Debt-to-Assets | Debt-to-Capital | Net Debt to EBITDA | Current Ratio | Quick Ratio | Financial Leverage |
|---|---|---|---|---|---|---|---|
| 2025 | 1.28 | 0.44 | 0.56 | -49.43 | 0.81 | 0.35 | 2.89 |
| 2024 | 1.11 | 0.42 | 0.53 | 5.02 | 0.52 | 0.25 | 2.64 |
| 2023 | 0.61 | 0.30 | 0.38 | 6.57 | 1.44 | 0.93 | 2.06 |
Debt ratios demonstrate cautious financial structuring but indicate potential liquidity constraints that could affect short-term obligations.
🟢 Fundamental Strength & Profitability
Profitability metrics such as Return on Equity (ROE) and asset-based returns are central to evaluating fundamental strength. Margins remain diverse, with net and EBIT margins offering insights into operational control. Notably, R&D spending is absent, implying limited focus on innovation-driven growth.
| Year | Return on Equity | Return on Assets | Net Margin | EBIT Margin | EBITDA Margin | Gross Margin | R&D to Revenue |
|---|---|---|---|---|---|---|---|
| 2025 | -20.23% | -7.01% | -14.10% | -7.54% | -1.78% | 38.79% | 0% |
| 2024 | 9.67% | 3.67% | 9.10% | 15.41% | 20.68% | 38.09% | 0% |
| 2023 | -1.25% | -0.61% | -1.07% | 1.67% | 6.73% | 32.85% | 0% |
The fluctuating ROE and margins reflect internal efficiency and cost management challenges, meriting attention for profitability improvements.
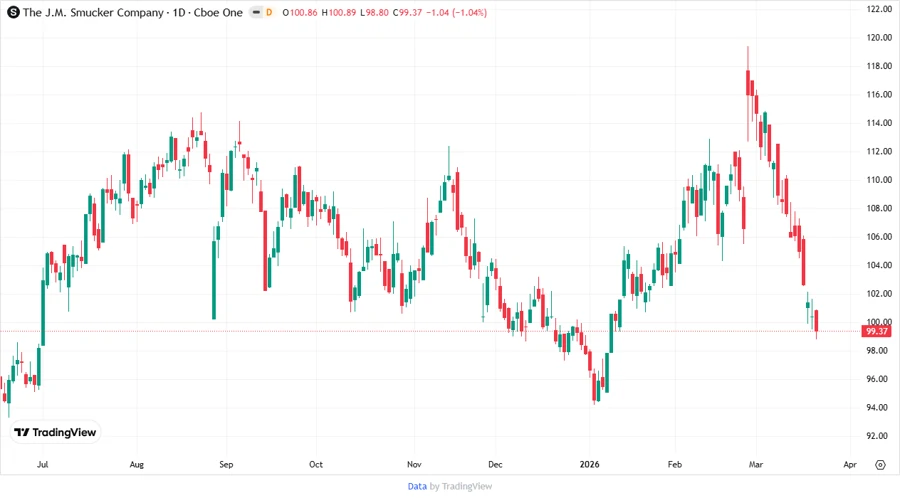
📈 Price Development
📊 Dividend Scoring System
| Category | Score (1-5) | Rating |
|---|---|---|
| Dividend yield | 4 | |
| Dividend Stability | 5 | |
| Dividend growth | 3 | |
| Payout ratio | 2 | |
| Financial stability | 2 | |
| Dividend continuity | 5 | |
| Cashflow Coverage | 3 | |
| Balance Sheet Quality | 3 |
Total Score: 27/40
⭐ Rating
In conclusion, The J.M. Smucker Company demonstrates a commendable track record in dividend consistency and growth, appealing to income investors. Yet, potential investors should scrutinize its financial health and profitability challenges closely. Though some leverage metrics indicate caution, its robust cash flow supports ongoing dividends, allowing for a favorable, yet cautious, investment outlook.
Smart Data Insight
Master the Perfect Entry & Exit for this Stock
Don't leave your profits to chance. Historically, this stock follows specific seasonal patterns that institutional traders use to maximize returns.
- ✅ Identify the "Golden Buying Window"
- ✅ Avoid high-risk correction cycles
- ✅ Backtested data from the last 20+ years