March 19, 2026 a 12:47 pm
SJM: Dividend Analysis - The J. M. Smucker Company
The J. M. Smucker Company offers an attractive dividend profile with a current dividend yield of 3.96% and a 33-year history of uninterrupted dividend payments. Despite challenges reflected in negative EPS payout ratios, the company remains committed to rewarding shareholders through dividends. However, close monitoring of the financial health is advisable.
Overview 📊
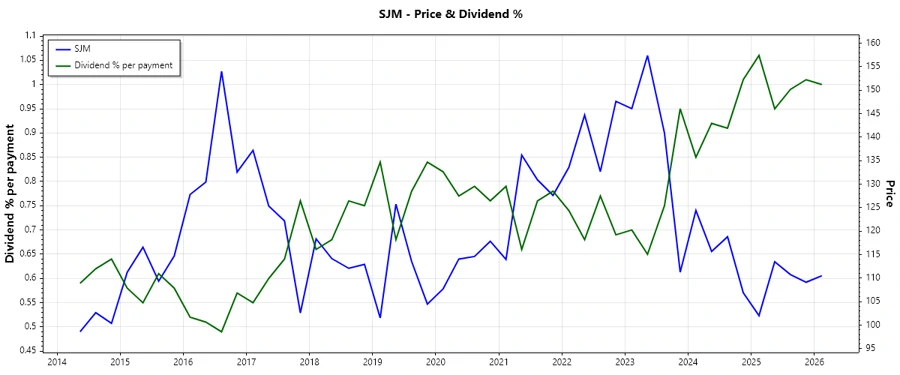
The J. M. Smucker Company operates within the Consumer Staples sector, which is known for its stability and resilience, especially in economic downturns. Currently, the company showcases a dividend yield of 3.96%, translating into a dividend of $4.28 per share annually. This reflects 33 years of consistent dividend history, positioning it as a reliable choice for income-seeking investors. The absence of any recent dividend cuts further underscores its stability.
| Attribute | Detail |
|---|---|
| Sector | Consumer Staples |
| Dividend yield | 3.96 % |
| Current dividend per share | $4.28 USD |
| Dividend history | 33 years |
| Last cut or suspension | None |
Dividend History 🗣️
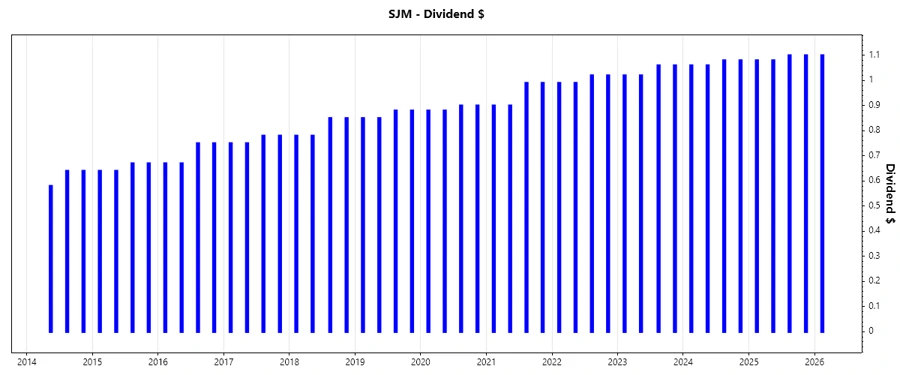
The company's dividend history is a testament to its reliability and consistency, having maintained and gradually increased dividends for over three decades. This historical performance is indicative of a strong commitment to shareholder returns, which is crucial for long-term dividend investors.
| Year | Dividend per Share (USD) |
|---|---|
| 2026 | 1.10 |
| 2025 | 4.36 |
| 2024 | 4.28 |
| 2023 | 4.16 |
| 2022 | 4.02 |
Dividend Growth 📈
An analysis of the dividend growth over the last 3 and 5 years shows a modest but steady increase. This steady growth is crucial for maintaining the purchasing power of dividend income over time, especially amidst inflationary pressures.
| Time | Growth (%) |
|---|---|
| 3 years | 2.74 % |
| 5 years | 4.14 % |
The average dividend growth is 4.14% over 5 years. This shows moderate but steady dividend growth.
Payout Ratio ⚠️
Understanding payout ratios is essential for gauging the sustainability of a dividend. The company's EPS-based payout ratio stands at a concerning -36.37%, suggesting dividends are not covered by earnings. Meanwhile, the FCF-based payout ratio is at a safer 47.02%, indicating reliance on cash flow rather than earnings.
| Key Figure | Ratio (%) |
|---|---|
| EPS-based | -36.37 % |
| Free cash flow-based | 47.02 % |
The negative EPS payout ratio is a red flag, but the FCF ratio shows that current dividends are sustainable through cash flow, which is vital for ongoing dividend payments.
Cashflow & Capital Efficiency 🏦
The company's cash flow and capital efficiency provide insights into its liquidity, operational efficiency, and capacity to sustain and grow dividends. With a Free Cash Flow Yield of 8.97% and moderate earnings yields, the financial flexibility supports strategic investments and potential dividend increments.
| Metric | 2025 | 2024 | 2023 |
|---|---|---|---|
| Free Cash Flow Yield | 6.60% | 5.38% | 4.30% |
| Earnings Yield | -9.95% | 6.22% | -0.55% |
| CAPEX to Operating Cash Flow | 32.53% | 47.71% | 39.65% |
| Stock-based Compensation to Revenue | 0.34% | 0.29% | 0.30% |
| Free Cash Flow / Operating Cash Flow Ratio | 67.47% | 52.29% | 60.35% |
The robust free cash flow yield indicates strong liquidity and financial flexibility, supporting healthy dividend policies and potential for future capital investments.
Balance Sheet & Leverage Analysis 📝
The balance sheet shows the company’s leverage and financial health. The leverage ratios suggest a well-managed debt structure, although the current and quick ratios indicate potential liquidity constraints.
| Metric | 2025 | 2024 | 2023 |
|---|---|---|---|
| Debt-to-Equity | 127% | 111% | 61% |
| Debt-to-Assets | 44% | 42% | 30% |
| Debt-to-Capital | 56% | 53% | 38% |
| Net Debt to EBITDA | -47.20 | 5.02 | 6.57 |
| Current Ratio | 0.84 | 0.52 | 1.44 |
| Quick Ratio | 0.35 | 0.25 | 0.93 |
| Financial Leverage | 2.89 | 2.64 | 2.06 |
While financial leverage and ratios indicate effective debt utilization, the liquidity position requires cautious monitoring to ensure financial stability.
Fundamental Strength & Profitability 📈
This section reveals the company’s profitability and core operational strengths. Low returns on equity and assets reflect efficiencies and competitive positioning, and minimal investment in R&D is noted.
| Metric | 2025 | 2024 | 2023 |
|---|---|---|---|
| Return on Equity | -20.23% | 9.67% | -1.25% |
| Return on Assets | -7.01% | 3.67% | -0.61% |
| Gross Margin | 38.79% | 38.09% | 32.85% |
| EBIT Margin | -7.54% | 15.41% | 1.67% |
| EBITDA Margin | -1.78% | 20.68% | 6.73% |
| Net Margin | -14.10% | 9.10% | -1.07% |
| Research & Development to Revenue | 0% | 0% | 0% |
Profitability metrics show a mixed outlook with periods of loss and positive returns, indicating potential volatility in core business operations.
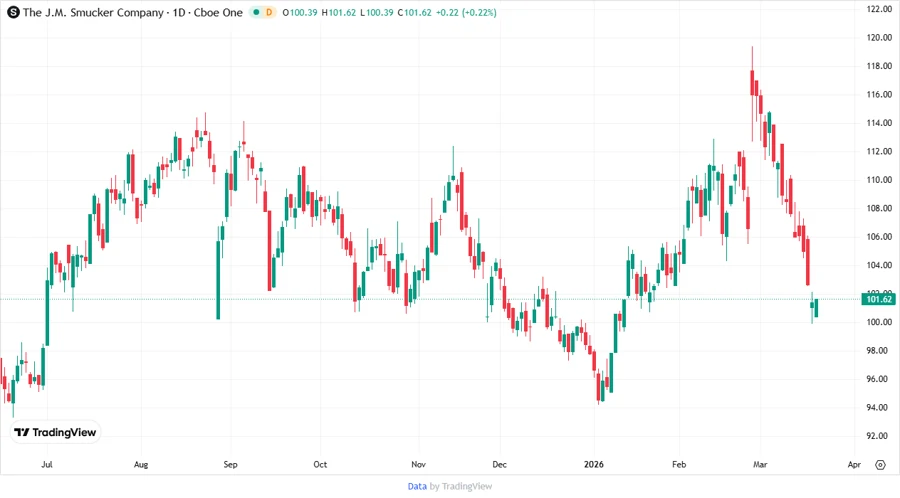
Price Development 📉
Dividend Scoring System 🎯
| Category | Score (1-5) | Score Bar |
|---|---|---|
| Dividend yield | 4 | |
| Dividend Stability | 5 | |
| Dividend growth | 3 | |
| Payout ratio | 2 | |
| Financial stability | 3 | |
| Dividend continuity | 5 | |
| Cashflow Coverage | 4 | |
| Balance Sheet Quality | 3 |
Overall Score: 29 / 40
Rating 🏅
The J. M. Smucker Company presents an attractive dividend profile fostered by historical reliability and moderate growth potential. While the dividend sustainability is backed by cash flow, negative earnings indicators raise cautionary flags. The overall financial health suggests a balanced approach, recommending the stock primarily for dividend-seeking investors with a tolerance for moderate risk.
Smart Data Insight
Master the Perfect Entry & Exit for this Stock
Don't leave your profits to chance. Historically, this stock follows specific seasonal patterns that institutional traders use to maximize returns.
- ✅ Identify the "Golden Buying Window"
- ✅ Avoid high-risk correction cycles
- ✅ Backtested data from the last 20+ years